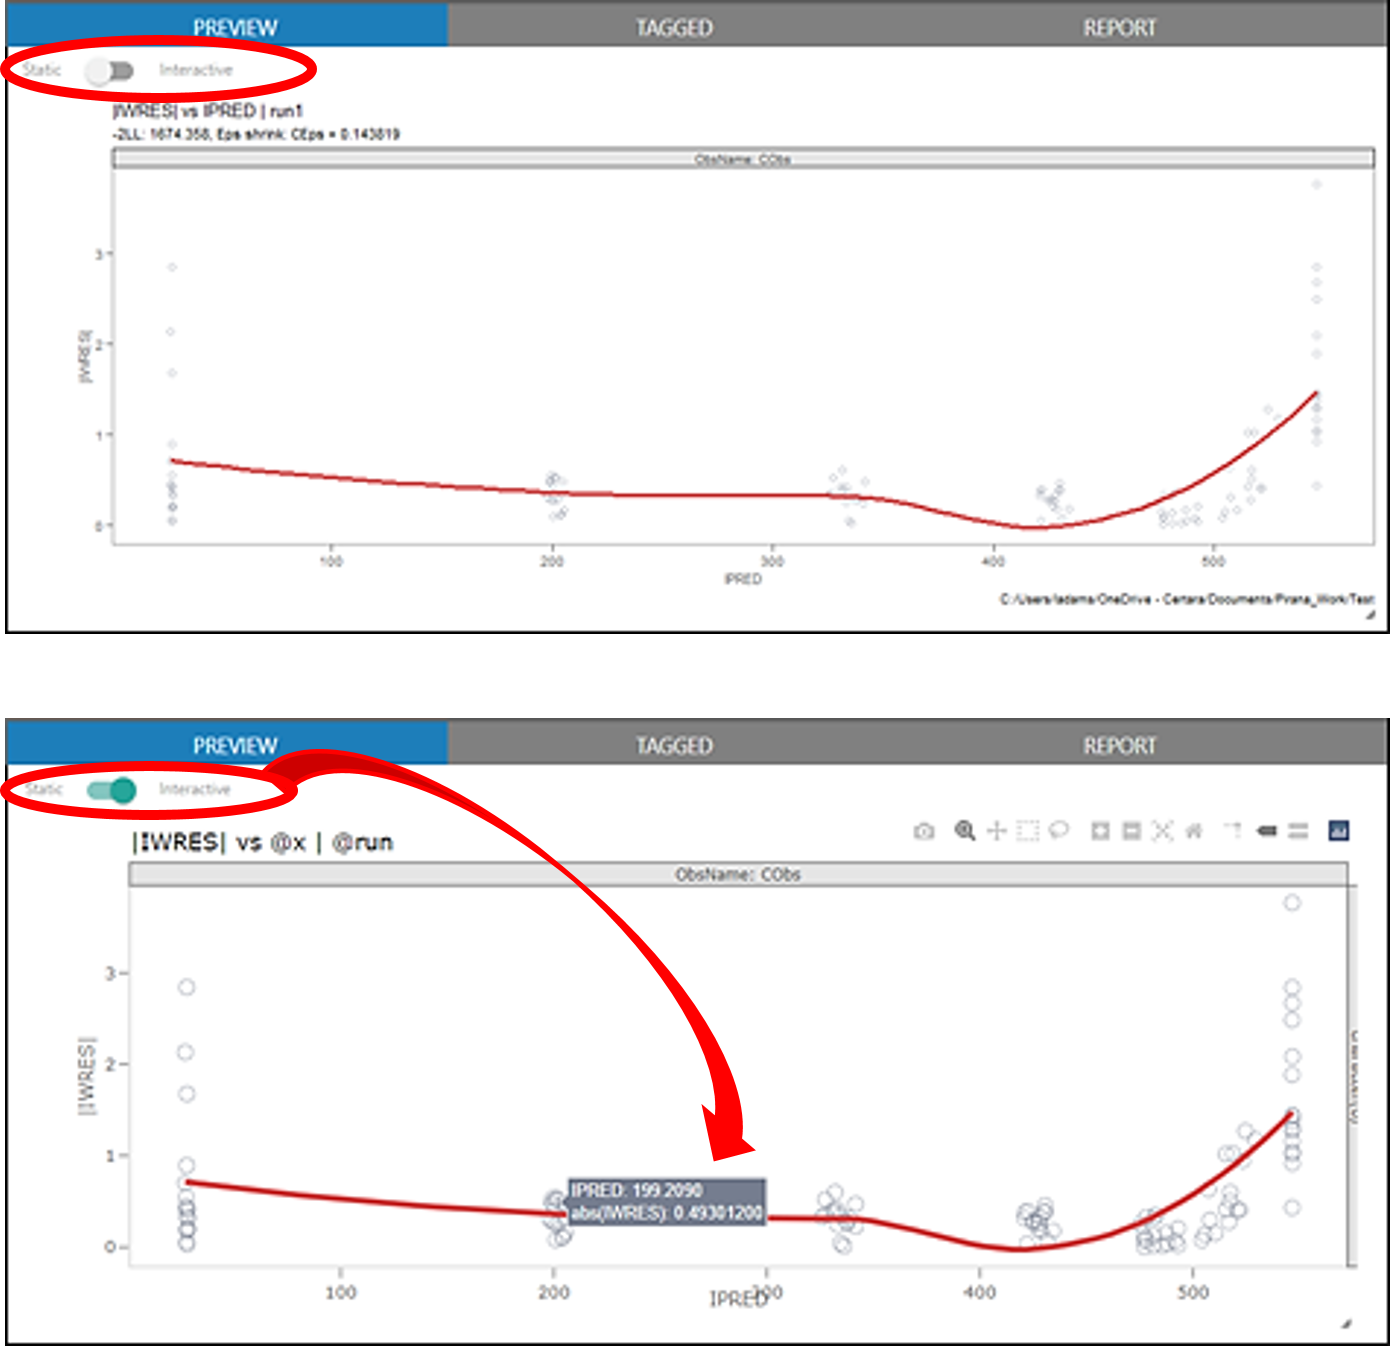
When a plot is selected from the diagnostics list, it is loaded into the PREVIEW tab on the right. Above the plot is a switch labeled Static/Interactive. A static plot is simply a drawn plot. In an interactive plot, hovering the mouse cursor over the plot displays additional details. Use the ![]() and
and ![]() icons in the toolbar above an interactive plot to switch between displaying the details of a single point or displaying the details of multiple points close to the mouse cursor, respectively.
icons in the toolbar above an interactive plot to switch between displaying the details of a single point or displaying the details of multiple points close to the mouse cursor, respectively.

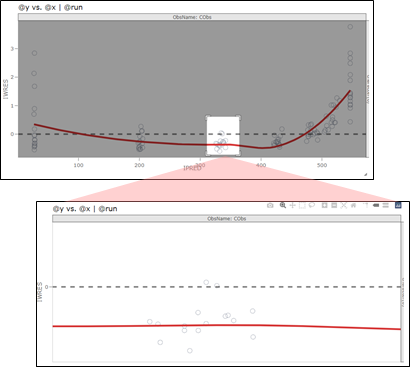
Zooming in on a particular part of the plot is also available in an interactive plot. Click and drag to highlight the area on the plot.

To return to displaying the full plot, double-click anywhere in the plot area.
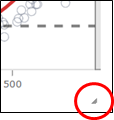
Whether a plot is static or interactive, the plot preview area can be resized by clicking and dragging the triangle in the lower right.

If a legend is available in an interactive plot, double-click an item in the legend to switch to a selection mode in which you can select (single click) items in the legend to show only the corresponding data in the preview area (a second single click on the item hides the corresponding data). Single clicking a second item adds the corresponding data to the preview area. To exit the selection mode and see all the data, double-click the legend again.