With the model selected in Pirana, choose the menu option Results > Model Results.
In the dialog:
– If you have previously saved your settings from an earlier Model Results session and want to load them, check the Use saved settings box.
– If you want to use diagnostics that were tagged in a previous session, check the Use tagged diagnostics box.
– Press the Run button to launch the Model Results Shiny app.
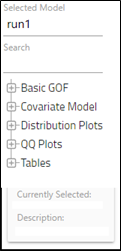
The main page lists all available diagnostics on the left.

– Type in the Search field above the diagnostics to filter the list.
– Click + before a category of diagnostics to expand.
Select a diagnostic plot or table from the list.
A preview of the plot or table is displayed in the PREVIEW tab on the right. Customization of the plot or table can be done using the tools below the preview area.
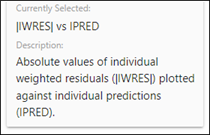
Also note that, below the list, the name of the currently selected item is shown, as well as a brief description.
