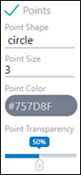
Below the preview area, there is a STYLE tab containing tools for customizing the appearance of the plot. This section provides descriptions of the different style tools. However, it is important to note that the tools presented in the interface will vary depending on the type of plot. The following image shows the style options available for plot points.
Display/Undisplay: Check the box next to the name of an item to display it in the plot. Uncheck the box to undisplay it. Such items include Points, Lines, Reference Lines, Smoothing, Text (data point labels), Legend, Histogram, Density, or Rug.
If the checkbox for an item is filled in, that item line is not applicable for the selected plot type.
Color: Select a color for the item by clicking in the colored oval and typing a hex color code or using the color palette. If you are using the palette, drag the white bar on the right to choose a general color scheme, then click in the area on the left to select the color.
Line Type: Select a type to use for displaying the line from the pull-down menu. Choices include: solid (—), dashed (- - -), dotted(···), dotdash (-·-·), longdash (– –), and twodash (–·–·).
Size: Type a value for the shape size or line thickness or use the up/down arrows to adjust the value.
Transparency: Adjust the percent transparency of the item by dragging the slider or clicking directly on the slider bar. (Does not apply to Legends or Rugs.)
The following are specific to a particular item.
Point Shape: Select a shape to use for the data points in the plot from the pull-down menu. Choices include: empty circle, filled circle, empty square, filled square, empty triangle, filled triangle.
Histogram N bins: Type the number of bins to use for the histogram (use the up/down arrows to adjust the value).
Legend Position: Select the location for the legend in relation to the plot from the pull-down menu. Choices include: bottom, top, left, and right.
Rug Sides: Select the position of the rug plot. Choices include: bottom, top, and both.
Smoothing Method: Select the method to use for smoothing from the pull-down menu. Choices include: loess, lm, glm, and gam.
Span: For Smoothing curve, type the proportion of points in the plot that are to influence the smoothing at each value (use the up/down arrows to adjust the value).