Below the preview area, there is a DISPLAY tab containing options for setting up tags and changing other general plot settings.
When the Default Text box is checked, predefined text and tags are used for titles and labels in each plot. When unchecked, the title and label options are listed and can be modified.
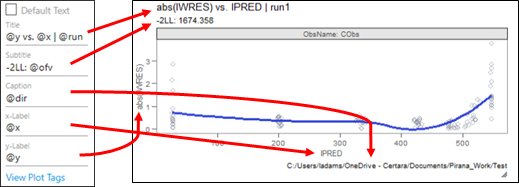
Type the text to display for each of the listed plot items (title, subtitle, caption, x-axis label, and y-axis label), incorporating tags where desired.
Click the View Plot Tags link to see a list of acceptable tags.
When the Certara Theme box is checked, predefined settings for borders, grid lines, background color, and text formatting are used. when uncheck, the options are listed and can be modified.
Border: Toggle the checkbox to show/hide a border line around the frame of the plot.
Grid Lines: Toggle the checkbox to show/hide a grid behind to plot.
Plot Background Color: Select the color for the plot background by clicking in the colored oval and typing a hex color code or using the color palette. If you are using the palette, drag the white bar on the right to choose a general color scheme, then click in the area on the left to select the color.
For the plot title, subtitle, caption, and axis labels, the following options are available:
Size: Type a value to use for the text size or use the up/down arrows to adjust the value.
Font: Select the type of font to use for the text. Choose from: sans, serif, mono.
Font Color: Select a color to use for the text by clicking in the colored oval and typing a hex color code or using the color palette. If you are using the palette, drag the white bar on the right to choose a general color scheme, then click in the area on the left to select the color.
Face: Select the style of font to use for the text. Choose from plain, bold, italic, bolditalic.