The Statistics tab is used to add summary statistics to a table. The available statistics are grouped into categories. Descriptions of the summary statistics can be found in the Descriptive Statistics “Available statistics” section.
Note: Table types 2 and 5 do not allow the addition of summary statistics and will display a message if the Statistics tab is selected.
The Combined Statistics category contains several combinations of statistics that are frequently reported together. such as the mean and the SD or SE value, or the minimum and maximum values in the column or row.
In the tree on the left, check the box(es) for statistics to compute and include in the report.
Checking/unchecking a category box controls all checkboxes for statistics within that category. For example, unchecking the Spread Statistics box unchecks the Min, Median, Max, and Range checkboxes.
Use Select All or Clear All above the tree to quickly check/uncheck all boxes in the list, respectively, with a single click.
Click ![]() to expand all categories in the tree. Click
to expand all categories in the tree. Click  to collapse all categories in the tree.
To change the confidence interval percentage:
Check the Confidence Interval box to enable editing of the percentage field.
Enter the new percentage to apply to the summary statistics in the field.
If desired, expand the Confidence Interval node and check/uncheck boxes for the individual confidence intervals statistics.
To change the number of standard deviations:
Check the Number of SD box to enable editing of the field.
Enter the new number of standard deviations to apply to the summary statistics in the field.
If desired, expand the Number of SD node and check/uncheck boxes for the individual standard deviation statistics.
When computing Combined Statistics, check the Append [N] box to append a count of the number of values included in the computation in square brackets to each combined statistic label.
If the Default table type is selected in the Options tab:
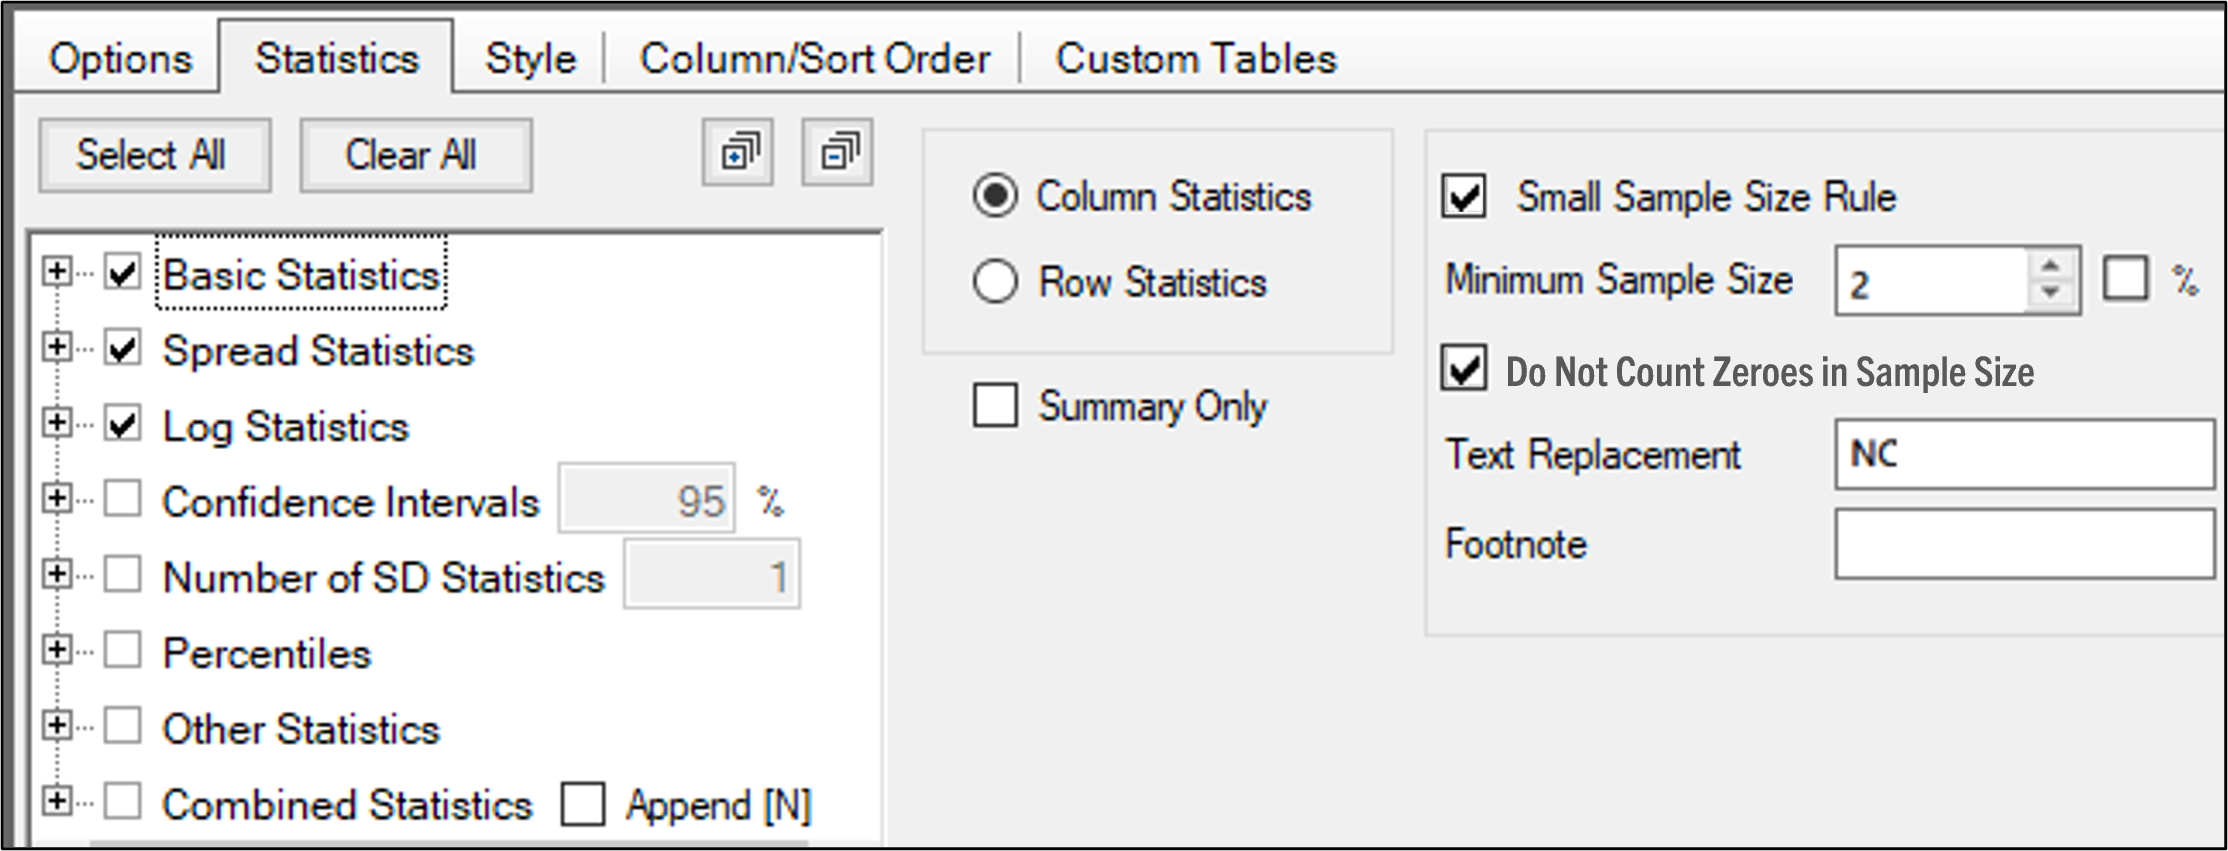
Choose whether to compute the Column Statistics or the Row Statistics.
Check the Summary Only box to include only the summary statistic information in the output table.
Set up a small sample size rule by checking the Small Sample Size Rule box.
Enter the Minimum Sample Size in the field (check the % box if the value is a percentage).
Sample sizes that are equal to or greater than the entered value are not considered to be small and the rule is not applied. If there are fewer samples than the entered value, the rule is applied.
Check the Do Not Count Zeroes in Sample Size box to indicate that a “0” (zero) is used in your dataset for non quantifiable concentrations (i.e., when no value is recorded). Uncheck the box if a “0” in your data is to be considered as an actual measurement of the concentration and counted as a sample.
In the Text Replacement field, enter the text to display for statistics that are not calculated due to the small sample size rule being applied.
If a table footnote is desired for tables in which a small sample size rule replacement has occurred, enter the Footnote text in the field.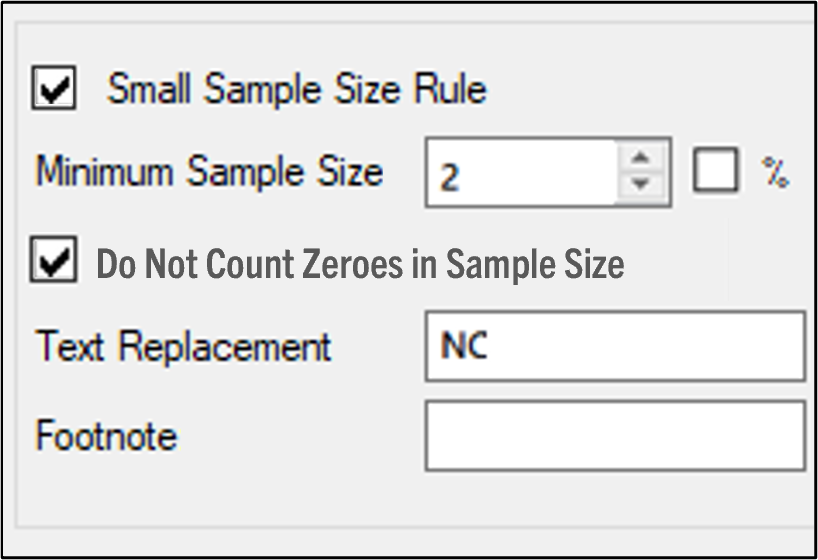
As an example, if the rule is set up as shown in the previous image, the system will count how many non-zero values it finds for the Data Variable (specified in the Options tab). If it finds two or more non-zero values, the Mean will be calculated. If it finds less than two non-zero values, the small sample size rule will be applied and the Mean will be reported as “NC” and a footnote is added listing the Text Replacement and the Footnote text entered in the fields.