Join data and modeling output example
This example shows how to reproduce table template 9 that was used in WinNonlin 5.3 and earlier. Phoenix does not have a specific table type for this template. The main difference between table template 9 and the other table templates in WinNonlin is that two datasets are joined to create the final output. The Phoenix Table object only works with one dataset at a time. To produce a table similar to table template 9 it is necessary to use Phoenix’s Join Worksheets object prior to creating the table.
In this example, two datasets are joined by the Sort variables in both datasets. The Default table type in Phoenix is used to recreate table template 9 in WinNonlin. These steps include:
Recreating WinNonlin’s table template 9 in Phoenix
This example uses two datasets, clayton.CSV and clayton_pk.dat. clayton.CSV contains time and concentration data for two formulations. clayton_pk.dat contains the Final Parameters output from a noncompartmental analysis.
Create a new project named Join.
Import the files …\Examples\WinNonlin\Supporting files\clayton.CSV and clayton_pk.dat.
In the File Import Wizard dialog, select the Has units row option for clayton.CSV only.
Right-click clayton in the Data folder and select Send To > Data Management > Join Worksheets.
Map the columns to the contexts as follows:
Subject to Sort.
Form to Sort.
Leave Period mapped to None.
Leave Seq mapped to None.
Hour to Source Column.
Conc to Source Column.
Select Worksheet 2 from the Setup list.
Drag the clayton_pk worksheet from the Data folder to the Join Worksheets object’s Worksheet 2 Mappings panel and map the input columns to the contexts as follows:
Subject to Sort.
Form to Sort.
Tmax to Source Column.
Cmax to Source Column.
AUClast to Source Column.
Leave the rest mapped to None.
Click ![]() (Execute icon) to execute the object.
(Execute icon) to execute the object.
Right-click Workflow in the Object Browser and select New > Reporting > Table.
In the Table 1 object’s Mappings panel click ![]() (Select Source icon).
(Select Source icon).
In the dialog, expand Join Worksheets, select Result, and click OK.
Map the input columns to the contexts as follows:
Subject to Row ID.
Form to Stratification Row.
Hour to Stratification Column.
Conc to Data.
Tmax, Cmax, and AUClast to Dependency.
Setting up the summary statistics
Select the Statistics tab below the Setup panel.
Check the checkboxes in the Display column to select the following summary statistics: N, Mean, SE.
Select the Options tab.
With Table selected in the Options menu tree, check the Page Break on Row Stratification checkbox.
Expand Precision/Alignment in the Options menu tree, click Hour and select 1 in the Value menu.
Under Precision/Alignment, click Subject in the Options menu tree and select 0 in the Value menu.
Enter a title for the table by selecting Titles in the Options menu tree.
In the Title field type Table 2 and click Add.
In the Title field type Raw Data and Pharmacokinetic Parameters and click Add.
Executing and viewing the results of the joining
Execute the object.
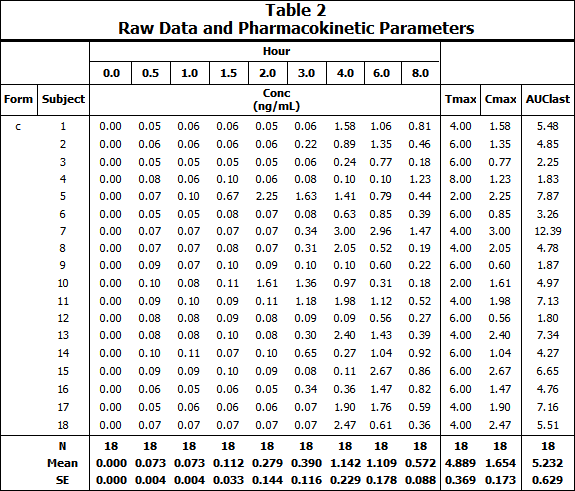
Default table type Formulation c results:
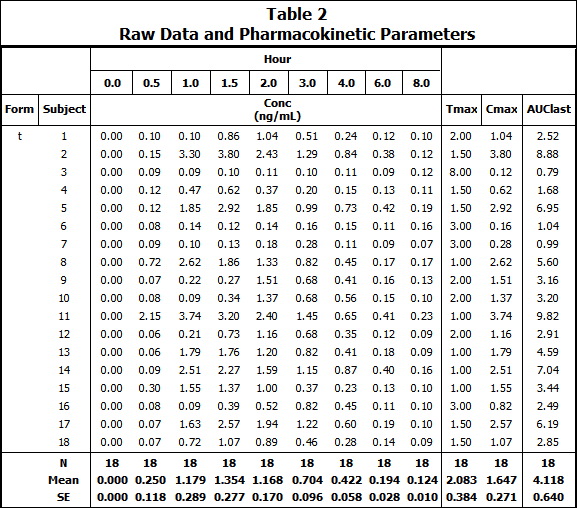
Default table type Formulation t results:
This concludes the Joining Raw Data and Model Output in Tables example.