Define data display and how quartiles and whiskers are generated
Select Graphs > <box plot name> in the tree, then click the Content tab.
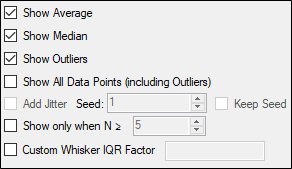
Use the following checkboxes to toggle the display of the item:
Show Average: Display of line indicating the average value of the data in the box plot.
Show Median: Display of line indicating the median value of the data in the box plot.
Show Outliers: Display of outliers in the plot.
Show All Data Points (including Outliers): Display of all data points in the plot display panel.
Add Jitter: Display non-outlier data points with a random x-offset to avoid overlap of y-values. Enter an initial Seed value for the random offset. Check the Keep Seed box to use the same starting seed for each execution. Otherwise, Phoenix assigns a random seed and results might vary if they are executed twice.
Show only when N >=: Display plot only when the number of data points is greater than or equal to the entered value.
Check the Custom Whisker IQR Factor box to enter a custom value used to calculate the IQR (interquartile range). The entered multiplier determines how far to extend both the top and bottom whiskers.