Joint contrasts are constructed when the number of columns for contrast is changed from the default value of one to a number larger than one. Note that this number must be no more than one less than the number of distinct levels for the model term of interest. This tests both hypotheses jointly, i.e., in a single test with a predetermined level of the test.
A second approach would be to put the same term in the neighboring contrast, both of which have one column. This approach will produce two independent tests, each of which is at the specified level.
To see the difference, compare Placebo to Low Dose and Placebo to Medium Dose. Using the first approach, enter the coefficients as follows.
Title = Join tests
Effect = Treatment
Contrast = Treatment
#1 Placebo –1 –1
#2 Low Dose 1 0
#3 Medium Dose 0 1
#4 High Dose 0 0
This will produce one test, testing the following hypothesis.
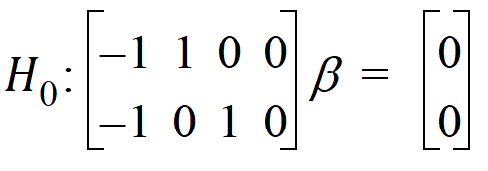
Now compare this with putting the second contrast in its own contrast.
Contrast #1
Title Low vs. Placebo
Effect Treatment
Contrast Treatment
#1 Placebo –1
#2 Low Dose 1
#3 Medium Dose 0
#4 High Dose 0
Contrast #2
Title Medium vs. Placebo
Effect Treatment
Contrast Treatment
#1 Placebo –1
#2 Low Dose 0
#3 Medium Dose 1
#4 High Dose 0
This produces two tests:

Note that this method inflates the overall Type I error rate to approximately 2a, whereas the joint test maintains the overall Type I error rate to a, at the possible expense of some power.