This example uses the Linear Mixed Effects (LinMix) capability in Phoenix to test for differences among treatment groups in a parallel study. Twenty-eight subjects were randomly assigned to four treatment groups. One observation of drug effect was measured from each subject for a total of seven observations per treatment. If statistically significant differences are observed between treatments, then the estimates, with intervals, are desired.
The model for these data is as follows.
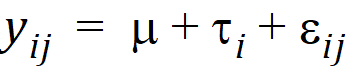
where:
i is the treatment index, 1, 2, 3, 4
j is the subject index within treatment, 1, 2, …, 7
yij is the observation value for treatment i, subject j
m is the overall mean
ti is the effect of treatment i
eij is the random error term for observation yij
Note: The completed project (LinMix_TreatmentEffects.phxproj) is available for reference in …\Examples\WinNonlin.
Create a new project with the name LinMix_TreatmentEffects.
Import the file …\Examples\WinNonlin\Supporting files\OneWayData.CSV.
Right-click OneWayData in the Data folder and select Send To > Computation Tools > Linear Mixed Effects.
In the Main Mappings panel, map the columns to the contexts as follows:
Treatment to Classification.
Response to Dependent.
In the Fixed Effects tab below the Setup panel, drag Treatment from the Classification list up to the Model Specification field (or type Treatment in the Model Specification field).
None is selected by default in the Dependent Variables Transformation menu. Do not change this setting.
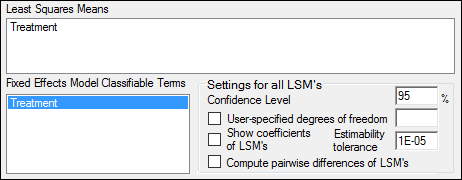
Select the Least Squares Means tab.
Drag Treatment from the Fixed Effects Model Classifiable Terms list to the Least Squares Means field.
Execute and evaluate the results
Click ![]() (Execute icon) to execute the object.
(Execute icon) to execute the object.
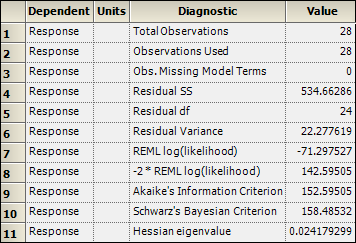
The Diagnostics results worksheet is opened by default in the Results tab.
Select Final Fixed Parameters in the Results list.
This model is over parameterized. There are five parameters, m, t1, t2, t3, t4, but there are only four means. The last parameter is removed from the model and is not estimated, resulting in the output of “Not estimable” for the Placebo group. When that happens, each of the other t parameters represents the difference between the treatment mean and the last treatment mean. Note that subtracting the Least Squares Means for high dose group from the mean for placebo produces the same number as t1. The parameter m is then the mean of the omitted treatment group, the placebo group in this case.
Select Least Squares Means in the Results list.
On the Least Squares Means (LSM) tab, Estimate, for balanced data, is the average of the observations within each treatment group. Also listed are the standard error of each mean, p value for the hypothesis that the true mean equals zero, and interval.
Select Partial Tests in the Results list.
In this case, the partial tests have the same value as the sequential test. This is always true for balanced datasets. For unbalanced data, these results can differ. Refer to the “Least squares means” section for more information on unbalanced data.
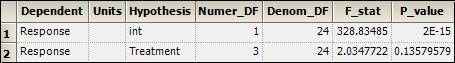
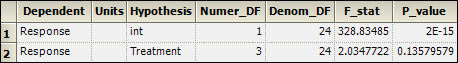
Select Sequential Tests in the Results list.
The p-value is shown as 0.1358, indicating that differences among treatment groups were not statistically significant.
This concludes the LinMix treatment effects analysis example.