The custom table types are included to provide additional reporting options. In custom table types, all output formatting, statistics, styles, sorting, and other options are predefined through an XML file and style sheets.
Once a custom table is defined, further option selections are not needed. The only possible selections are mapping the input data types to the mapping contexts in the custom table.
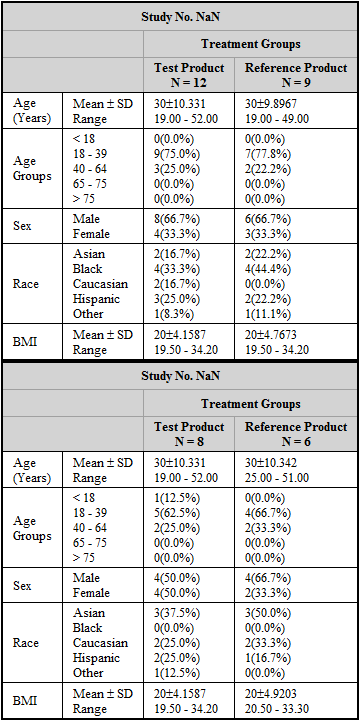
This example uses a dataset that contains demographic data for a population used in a bioequivalence study.
Note: There may be multiple paths to accomplishing a step (e.g., main menu, right-click menu, drag-and-drop, etc.). For simplicity, only one is listed here.
The completed project (Tables.phxproj) is available for reference in …\Examples\Data and Plots.
Add a table object using the Send To menu
From within an open project, import the file …\Examples\WinNonlin\Supporting files\Bioequivalence Demographics.dat.
Right-click Bioequivalence Demographics in the Data folder and select Send To > Reporting > Table.
Select the Custom Tables tab below the Setup panel.
In the Select Custom Table menu, select Bioequivalence Demographics.
All other tabs are removed from the Table object user interface when a custom table is selected. This is because the custom table type contains preconfigured table options.
The study data types are automatically mapped to the appropriate mapping contexts.
Execute and view the results
1. Execute the object.
Bioequivalence Demographics table results:

This concludes the Using Custom Tables example. You may save the project or close it.