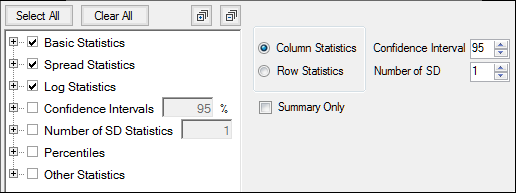
The Statistics tab is used to add summary statistics to a table. Table types 2 and 5 do not allow the addition of summary statistics and will display a message if the Statistics tab is selected.

For a complete list of available summary statistics and descriptions of each one, refer to the Descriptive Statistics “Available statistics” section.
In the tree on the left, check the box(es) for statistics to compute and include in the report.
The available statistics are grouped into categories. Checking/unchecking a category box controls all checkboxes for statistics within that category. For example, unchecking the Spread Statistics box unchecks the Min, Median, Max, and Range checkboxes.
Press Select All or Clear All to quickly check/uncheck all boxes in the list, respectively, with a single click.
Click ![]() to expand all categories in the tree. Click
to expand all categories in the tree. Click  to collapse all categories in the tree.
If the Default table type is selected:
a. Choose whether to compute the Column Statistics or the Row Statistics.
b. Check the Summary Only box to include only the summary statistic information in the output table.
To change the confidence interval percentage:
a. Check the Confidence Interval box to enable editing of the percentage field.
b. Enter the new percentage to apply to the summary statistics in the field.
c. If desired, expand the Confidence Interval node and check/uncheck boxes for the individual confidence intervals statistics.
To change the number of standard deviations:
a. Check the Number of SD box to enable editing of the field.
b. Enter the new number of standard deviations to apply to the summary statistics in the field.
c. If desired, expand the Number of SD node and check/uncheck boxes for the individual standard deviation statistics.