Create report-ready table from NCA results example
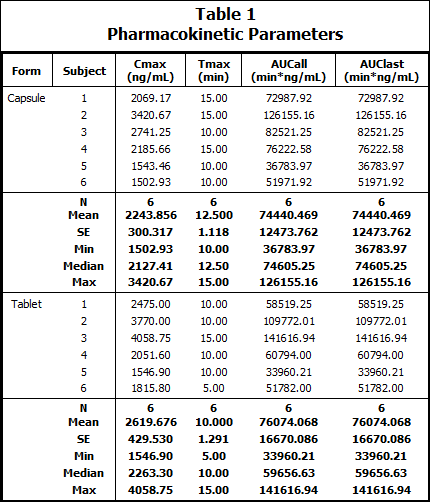
PK parameters for six subjects for both Tablet and Capsule formulations were computed as the input data for this example. A table will be created using the parameters Cmax, Tmax, AUCall, and AUClast.
Note: There may be multiple paths to accomplishing a step (e.g., main menu, right-click menu, drag-and-drop, etc.). For simplicity, only one is listed here.
The completed project (Tables.phxproj) is available for reference in …\Examples\Data and Plots.
Import the final parameter estimates data
Create a new project with the name Tables.
Import the file …\Examples\WinNonlin\Supporting files\Profiles Output.xls.
In the File Import Wizard dialog:
a. Use the Next Arrow button to move through the worksheets being imported.
b. For the Final Parameters Pivoted, Dosing Used, and Summary Table worksheets, select the Has units row option.
c. Press Finish.
Set up the Table object
1. Right-click Final Parameters Pivoted in the Data folder and select Send To > Reporting > Table.
2. In the Options tab below the Setup panel, select Table 3 - Column Detail and Summary by Row Stratification from the Table Type menu.
Select Table Preview in the Setup list to view an example of this table type.
3. Map the data types as follows:
Subject to Row ID.
Form to Stratification Row.
Tmax, Cmax, AUClast, and AUCall to Data. (These variables provide data for the body of the table.)
Leave the rest mapped to None.
Table type 3 sorts by the row variable within values of the stratification row variable. It does not compute summary statistics for each level of the row variable. Table type 3 also sorts the data by stratification row variable value and computes summary statistics for each value.
Select and format summary statistics
1. Select the Statistics tab below the Setup panel.
2. Expand the Basic Statistics node.
3. Check the boxes for N, Mean, SE.
4. Expand the Spread Statistics node.
5. Check the boxes for Min, Median, Max.
6. Change the precision value for subject.
a. Select the Options tab.
b. Expand the Precision/Alignment node in the menu tree, and select Subject.
c. Select 0 in the Value menu.
7. Enter a title for the table.
a. Select Titles in the Options menu tree.
b. In the Title field type Table 1 and press Add.
c. Continue typing Pharmacokinetic Parameters in the Title field and press Add.
8. Specify the column order
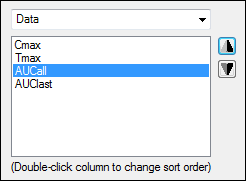
a. Select the Column/Sort Order tab.
The columns in the final table are displayed in the order set here. Use the up arrow and down arrow buttons to change the order.
The menu offers the following options:
Row Stratification lists study parameter(s) mapped to Row Stratification.
Row ID lists study parameter(s) mapped to Row ID.
Data lists study parameter(s) mapped to Data.
Statistics lists the items selected on the Statistics tab.
b. Select Data from the menu.
c. Select Cmax in the Column Order list and click the Up Arrow button.
d. Select AUCall in the list and click the Up Arrow button.
The Table object’s Style tab can be used to change the table display options, such as font, font size, font color, and alignment. Style selections are not necessary for this example.
Execute and view the Table object results
1. Click ![]() (Execute icon) to execute the object.
(Execute icon) to execute the object.
Table type 3 results:
This concludes the Create Report-Ready Table example. You may save the project or close it.