Using PsN and R Shell objects to generate VPC plots
This example involves the Xpose package for R. Make sure that this package is installed for R (http://xpose.sourceforge.net/docs_install.php).
The completed project (EX04_PsN_Xpose_VPC.phxproj) is available for reference in …\Examples\PsN.
Set up the project and data
Create a new project named Ex04_PsN_Xpose_VPC.
Import the PsN control file nm_final.ctl and the dataset file nonmem.csv from …\Examples\PsN\Xpose_VPC.
In the File Import Wizard dialog, click Finish.
Set up the PsN Shell object
1. Right-click Workflow in the Object Browser and select New > External Software > PsN Shell.
2. In the Options tab, press Select Sources from Phoenix Project.
3. In the Select Sources dialog, expand the Code folder, check the nm_final box, and press OK.
4. In the Setup list, click NONMEM.CSV.
5. Drag the nonmem worksheet from the Data folder to the Main Mappings.
6. Specify the Root Working Directory, if needed. You must have write permission for the selected folder.
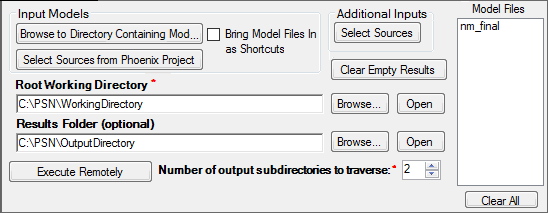
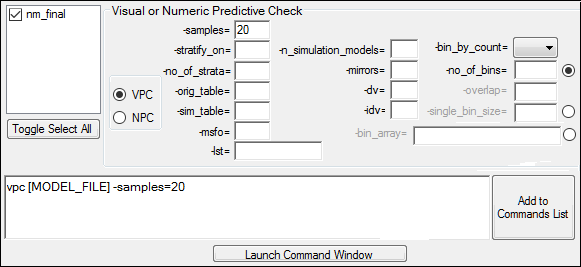
7. Select the VPC tab and build a command.
a. Make sure the nm_final box is checked in the model list.
b. Keep the -samples option set to 20.
8. Press Add to Commands List.
9. Select the Result Filters tab.
10. Type vpc_results.csv in the field and press Add.
11. Set the Import Format pull-down to Import as Binary.
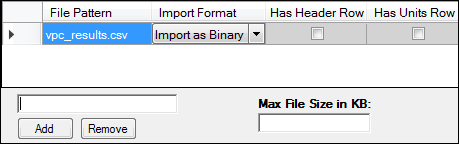
12. Execute the object.
Set up the R Shell object
1. Import the R command file Xpose_VPC.R from …\Examples\PsN\Xpose_VPC.
2. Right-click Xpose_VPC in the Code folder and select Send To > External Software > R Shell.
3. Press Select Sources in the Options tab and navigate to Workflow > PsN Shell.
4. In the Text Output folder, check the vpctab box.
5. In the Other folder, check the vpc_results box, then press OK.
6. Execute the R Shell object and observe the VPC plots generated by Xpose.
This concludes the “Using PsN Shell and R Shell objects to generate VPC plots” example. You may save the project or close it.