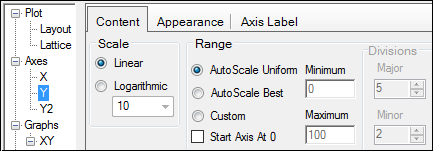
Select Axes > X, Y, or Y2 in the tree, then click the Content tab.
Scaling is available for the X-. Y- and Y2-axes for all plot objects and the X-axis for QQ, Scatter Plot Matrix, and XY Plots.

Select whether to perform Linear or Logarithmic scaling of the axis.
If Logarithmic is specified, select the logarithmic base. Options include: 2, 10, e (base of the natural logarithm).