Set plot background and border
Select Plot > Layout in the tree, then click the Appearance tab.

Choose a color using the Palette tab, Named tab, or System tab.
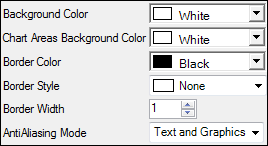
Background Color is used as the background of the plot display panel.
Chart Areas Background Color is used as the background for each plot.
Border Color is used to color the border of the plot display panel.
From the Border Style menu, select the border style to display around each graph.
From the Border Width field, select or type the width for the plot borders. (Maximum is 20 points.)
From the AntiAliasing Mode menu, select the part of the plot to be smoothed through anti-aliasing:
None (default)
Text: smooth the lines in text only
Graphics: smooth the lines in the graphs only
Text and Graphics: smooth all lines (text and graphs)
Note that anti-aliasing can slow down performance.