The Reference Lines options add reference lines to the X, Y, or Y2 axes of a plot. Reference lines are useful for highlighting base lines or therapeutic ranges in a plot. Added reference lines are listed in the table.
Select Reference Lines in the tree and then click the Reference Lines tab.

Press Add to add a row in the table.
Use the Axis column drop-down menu to select the axis to use for the reference line.
In the Value column, type the axis value on which to place the reference line.
In the Title column, type a title for the reference line (optional).
Click […] in the Font column to display the Font dialog for changing the format of the text (font, font size, font style, and effects).
In the Title Position column, select the location where the title is to be displayed relative to the axis.
From the Color menu, select the reference line color using the Palette, Named, or System tab.
From the Style menu, select the reference line style.
In the Line Weight box, select or type the reference line weight.
To remove a reference line, click the red X in the corresponding row in the table.
Line of unity
For XY and QQ Plot objects and the Levy plot generated by the IVIVC object, options are available on the Unity Line tab for the line of unity, where Y=X. The two axes must use the same scaling (i.e., both are linear or both are logarithmic) for the options to be active.
1. Select Reference Lines in the tree and then click the Unity Line tab.

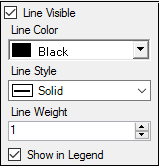
2. Check the Line Visible box to add a unity line to the plots and enable the Line of Unity settings. Uncheck the box to hide the unity line.
3. From the Line Color menu, select the unity line color using the Palette, Named, or System tab.
4. From the Line Style menu, select the unity line style.
5. In the Line Weight box, select or type the weight of the unity line.
6. Check the Show in Legend box to include the unity line in the legend.