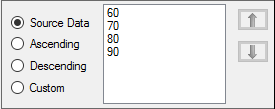
Select Axes > X in the tree, then click the Order tab.
Note: The Order tab is available only for the X axis of X-Categorical XY, Bar, Column, and Box plots.

The available X axis values are displayed in the list.
Choose the order in which the values appear along the X axis of the plot:
Source Data: Order the values as they appear in the source data.
Ascending: Order the values from least to greatest.
Descending: Order the values from greatest to least.
Custom: Select a value and use the arrows to arrange the values to the desired order.