Additional information on Box Plot results
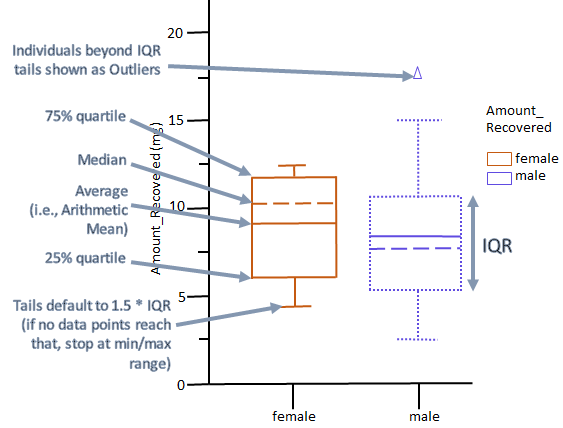
The dashed line is the median.
The solid line is the arithmetic mean.
The ends of the “box” are the 25th and 75th percentiles, which are computed by the same method as in Descriptive Statistics. These are also referred to as the first and third quartiles.
The whiskers show the lowest data value still within 1.5 IQR of the lower quartile, and the highest value still within 1.5 IQR of the upper quartile, where IQR is the interquartile range (the difference between the third and first quartiles, the middle 50%). Use the Custom Whisker IQR factor option in the Content tab to change the multiplier of IQR to a value other than 1.5.
Data values that do not fall between the whiskers are plotted as outliers (markers outside of the whiskers).
