Note: Box, Histogram, and QQ plot objects do not support having multiple plots generated from the same Plot object, so the Graphs tab controls are unavailable for those plots.
Select Plot > Layout in the tree, then click the Graphs tab.

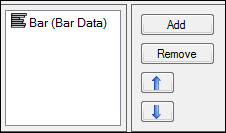
Press Add to add another plot to the Plot object.
A plot is added to the list in the Graphs tab and an input item is added to the Setup tab list.
Map a dataset to the additional plot object using the same steps listed in the “Data Mappings panel” section.
To remove a plot, select a plot in the plot list in the Graphs tab and press Remove.
Use the up and down arrow buttons to change the ordering of the plots in the list.
Note: Plots are given a default name based on the variables mapped to the X, Y, and Y2 contexts.