Study data can be mapped to PKS structures and saved as a .map file, loaded from an existing map file on a disk, or loaded from an existing .map file in the PKS.
Creating and saving a .map file
Loading a study map from a file
Creating and saving a .map file
Load a Phoenix project file (*.phxproj) or create a new project.
Select PKS > Create Study.
In the Create Study dialog, select the Study Data tab.
In the Study Data tab, select a data source and press Map Study Data.
In the Study Mapping dialog, all the source columns in the worksheet are listed on the left. The various contexts for mapping are shown as tabs on the right.
To map a column to a Subject Identifier, Demographic, Samples, or Doses context, click and drag the source column from the list on the left to the list in the context tab. For example, drag the column that uniquely identifies subjects from the Source Column list to the list in the Subject Identifiers tab.
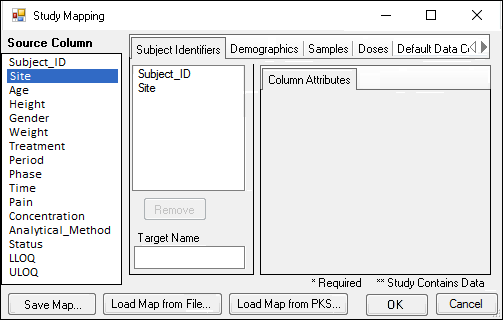
Use the Remove button to unmap a selected column.
Enter an alternative name for the selected column by typing it in the Target Name field.
Select the mapped column in the list to display attributes that can be modified.
Specify column attributes and defaults for data collection points or treatments.
If the attribute values are in a separate column, click and drag that column to the attribute field. For example, if units are recorded as a separate column in the data source, click and drag that column name from the Source Column list to the Units attribute text field.
If the attribute value is always the same (i.e., static), enter that value and select the Static checkbox.
The Demographics tab maps subject data such as demographics and covariates. The selected demographic columns must contain values that exist once per subject. That is, the values are not time or visit dependent.
The Samples tab is for mapping time-dependent sample results and contains the following column attributes.
Unit: Units of measurement.
Status: Indicates data status, for example, below a limit of quantification (BQL), or missing due to dropout or non-adherence. Valid data are finite. The list of statuses is defined by a PKS administrator.
Sample_Number: Sample identifier.
Sample_Matrix: Identifier for the sample matrix.
Sample_Description: Further information about the sample.
Analytical Method: Assay or technique used to obtain the sample data.
LLOQ: Lower limit of quantification for the assay. A numerical value.
ULOQ: Upper limit of quantification for the assay. A numerical value.
The Doses tabs contain the following column attributes.
Unit: Units of measurement.
Status: Indicate data status, for example, below a limit of quantification (BQL), or missing due to dropout or non-adherence. Valid data are finite. The list of statuses is defined by a PKS administrator.
Sample_Number: Sample identifier.
Sample Description: Text information about the sample.
Route: Variable identifying route, oral, IV, IM, etc., for each dose.
The Data Collection Point tab (and Default Data Collection Point tab) is used to specify columns that contain data used to uniquely identify events where samples were collected or doses were administered. The mappings can be overridden per dose or sample. The following column attributes are available on the Data Collection Point tab:
Period: Identifier for the period of the study.
Phase: Identifier for phase of the study.
Matrix: Matrix value, if study involves a matrix of analyte and concentration combinations.
Day: Number of days after the study, phase, period started.
Visit: Identifier for the visit during which observation was made/sample was taken.
Analyte: ID of the analyte used.
DCP Description: (Data Collection Point description) use this field for variables that distinguish different measurements stored a single observation column, for example, an indicator variable noting whether a given record contains a measurement of plasma concentration or pain score.
Relative_Nominal_Time: Scheduled time of observation or sampling since last dose.
Nominal_Time_Unit: Sample identifier.
Relative_Nominal_End_Time: Identifier for the sample matrix.
Relative_Actual_Time: Further information about the sample.
Relative_Actual_End_Time: Assay or technique used to obtain the sample data.
Actual_Clock_Time: Lower limit of quantification for the assay. A numerical value.
The Treatment tab (and Default Treatment tab) is used to specify columns that uniquely identify administered treatments. Treatment information is combined with data collection point information to uniquely identify events where samples were collected or doses were administered. The following column attributes are available on the Treatment tab:
Treatment: Variable identifying the treatment.
Treatment_Description: Additional descriptive field.
Route: Variable identifying route, oral, IV, IM, etc., for each dose.
Regimen: Variable identifying dose regimen.
Fasted_Fed: Variable identifying whether subject ate before dosing.
Formulation: Variable identifying drug formulation for each dose.
State: Additional descriptive field.
The Default Treatment mappings can be overridden per dose or sample.
Press OK. The Save As dialog is displayed.
Select a directory in which to save the .map file and type a name in the File name field. Press Save.
Press OK in the Study Mapping dialog.
The map file is used to create the study.
Loading a study map from a file
1. In the Study Data tab of the Create Study dialog, select a data source and press Map Study Data.
2. Press Load Map from File. which displays the Open dialog.
3. In the Open dialog, search for and select the .map file.
4. Press Open to load the .map file.
5. Press OK to close the Study Mapping dialog.
The loaded mappings are applied and attached to the study.
The mappings are applied to the selected data source as closely as possible. Phoenix displays warning messages if there are any problems with the mappings.
1. In the Study Data tab of the Create Study dialog, select a data source and press Map Study Data.
2. Press Load Map from PKS.
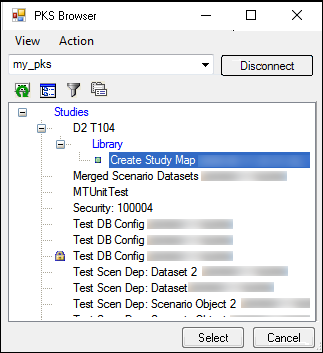
3. In the PKS Browser, click the (+) sign beside the study that contains the mappings and select the map file.
4. Press Select to load the map file.
The loaded mappings are applied and attached to the study.
The mappings are applied to the selected data source as closely as possible. Phoenix displays warning messages if there are any problems with the mappings.
5. (Optional) Click through the study mapping tabs to make any changes.
6. Press OK to close the Study Mapping dialog.
7. In the Save As dialog, save the mapping file.