The NCA tool provides special methods to analyze concentration data where few observations were taken per subject and multiple subjects were used to achieve a complete set of observations over time. NCA treats this sparse data as a special case of discrete or interval data. It first calculates the mean concentration curve of the data, by taking the mean concentration value for each unique time value for discrete data, or the mean rate value for each unique midpoint for interval data. For this reason, it is recommended to use nominal time, rather than actual time, for these analyses. The standard error of the data at each unique time or midpoint value is also calculated (SEM).
Using the mean concentration curve, NCA calculates all of the usual discrete or interval final parameters. In addition, it uses the subject information to calculate standard errors that will account for any correlations in the data resulting from repeated sampling of individual animals.
Note: The NCA sparse methodology calculates parameters based on the mean profile for all subjects in the dataset. If multiple time points are observed for each subject, this methodology only generates unbiased estimates if equal sample sizes per time point are used. Otherwise, estimates may be biased.
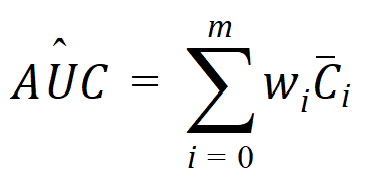
When multiple time points are observed for each subject, the sparse methodology only generates unbiased parameter estimates if equal sample sizes per time point are used. For discrete data, NCA will calculate the standard error for the mean concentration curve’s maximum value (Cmax), and for the area under the mean concentration curve (AUChat) from dose time through the final observed time. Standard error of the mean Cmax will be calculated as the sample standard deviation of the y-values at time Tmax divided by the square root of the number of observations at Tmax. Standard error of the mean AUC will be calculated as described in Nedelman and Jia (1998) [An extension of Satterthwaite's approximation applied to pharmacokinetics. J Biopharm Stat 8(2):317–28] using a modification in Holder (2001) [Comments on Nedelman and Jia's extension of Satterthwaite's approximation applied to pharmacokinetics. J Biopharm Stat 11(1-2):75–9] and will account for any correlations in the data resulting from repeated sampling of individual animals. Specifically:

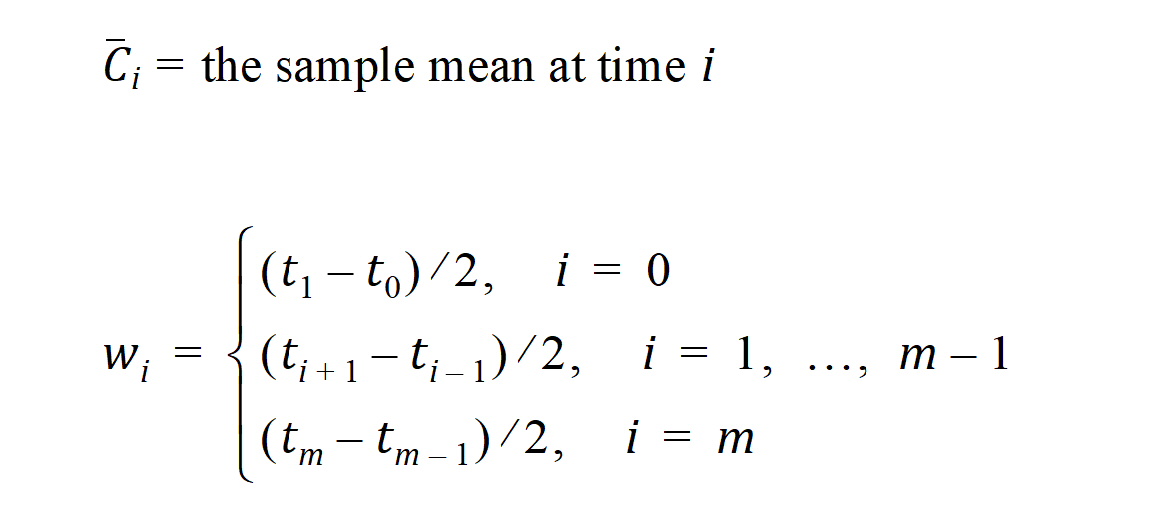
Since AUC is calculated by the linear trapezoidal rule as a linear combination of the mean concentration values,

where:

m=last observation time for AUCall, or time of last measurable (positive) mean concentration for AUClast
it follows that:

where:
rij = number of animals sampled at both times i and j
ri = number of animals sampled at time i
si2 = sample variance of concentrations at time i
sij = sample covariance between concentrations cik and cjk for all animals k that are sampled at both times i and j
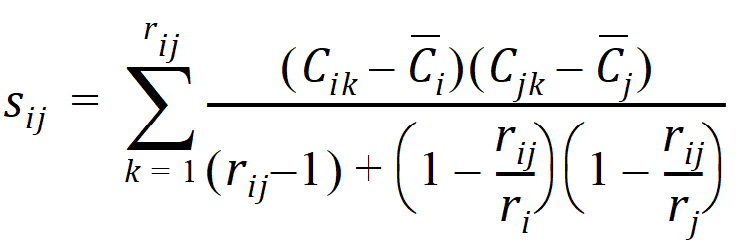
The above equations can be computed from basic statistics, and appear as equation (7.vii) in Nedelman and Jia (1998). When computing the sample covariances in the above, NCA uses the unbiased sample covariance estimator, which can be found as equation (A3) in Holder (2001):

For urine models, the standard errors are computed for maximum observed excretion rate (Max_Rate) and the area under the average concentration curve through Mid_Pt_last and the final observed rate (AURC_last and AURC_all).
The AUCs must be calculated using one of the linear trapezoidal rules for the SE of the AUCs to be computed, because the method in Nedelman/Jia for computing SE depends on the AUC parameter being a linear combination of the mean concentration values in order to evaluate the correlation that is caused by an animal being resampled at certain times. (Note that the data must be sorted by time and then subject within time to perform the computations.).
For cases where a non-zero value C0 must be inserted at dose time t0 to obtain better AUC estimates, the AUC estimate contains an additional constant term: C*=C0(t1 – t0)/2. In other words, w0 is multiplied by C0, instead of being multiplied by zero as occurs when the point (0,0) is inserted. An added constant in AÛC will not change Var(AÛC), so SE_AUClast and SE_AUCall also will not change. Note that the inserted C0 is treated as a constant even when it must be estimated from other points in the dataset, so that the variances and covariances of those other data points are not duplicated in the Var(AÛC) computation.
The case in which rij=1, and ri=1 or rj=1, then sij is set to 0 (zero) is not addressed in the Nedelman and Jia paper. The reason that this case causes a problem is that, when computing the variance of AUC (equation 7.vii in Nedelman and Jia), the unbiased sample variance si2 is 0/0, so it is undefined (recall the unbiased sample variance has division by ri – 1), and also the unbiased sample covariance sij (in Holder) is undefined. In the case where all pairs of time points but one had multiple animals in common, this one pair would cause the variance of AUC to become undefined, which would mean that a value for SE_AUC could not be computed. It was decided to substitute the biased sample variance, which is 0/1 = 0, for the unbiased sample variance (recall the biased sample variance has division by ri), and similarly for the biased sample covariance. In other words, the pairs of time points where there is only one animal in common do not contribute anything to the total variance of AUC, but SE_AUC can still be computed.
Refer to the “Data checking and pre-treatment” section for informations on inserting initial time points.