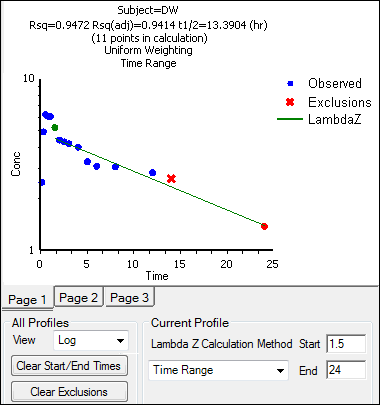
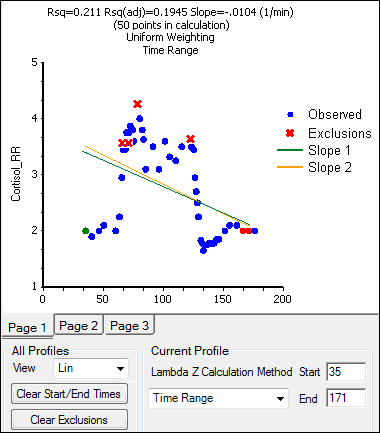
Phoenix attempts to estimate the rate constant, Lambda Z, associated with the terminal elimination phase for concentration data. If Lambda Z is estimable, parameters for concentration data will be extrapolated to infinity. For drug effect models, Phoenix estimates the two slopes at the beginning and end of the data. NCA does not extrapolate beyond the observed data for drug effect models.
The observed times for each profile are displayed in a graph on separate tabs in the Slopes Selector panel. Below are usage instructions. For descriptions of how the NCA object determines Lambda Z or slope estimation settings, see the “Lambda Z or Slope Estimation settings” section.
Note: Any changes to the settings available in the Slopes Selector panel also affect the Slopes panel and vice versa.
Use the View menu to select a linear (Lin) or logarithmic (Log) axis scale.
Use the Lambda Z Calculation Method menu to select a method.
If Best Fit is selected, Phoenix calculates the points for Lambda Z estimation for each profile.
If Time Range is selected, enter the start and end times for Lambda Z estimation or manually select them as described below.
To turn off Lambda Z or slope estimation for all profiles, select the Disable Curve Stripping checkbox in the Options tab.
For more information see step 4 in the “Model settings” section.
Manually select start times, end times, and excluded time points by selecting them on the graph for each profile (this action automatically sets the Lambda Z Calculation Method to Time Range.
Click a data point on a graph to select the start time.
SHIFT+click a data point on a graph to select the end time.
CTRL+click a data point on a graph to exclude the time point.
Change the start time, end time, and exclusions by selecting new points on the graph using the same key combinations listed above.
When the start time, end time, and exclusions are manually selected, the graph title is updated to show the new R2 calculation, the graph is updated to show the new slope, and the legend is updated to show the new slope and exclusions, as shown below.

Note: Excluded data points apply only to Lambda Z or slope calculations. The excluded data points are still included in the computation of AUCs, moments, etc.
Use the Clear Start/End Times button to have previously selected start time and end time points removed from the graphs in the Slopes Selector panel and from the worksheet in the Slopes panel.
Use the Clear Exclusions button to have previously excluded time points included in the graphs in the Slopes Selector panel and in the worksheet in the Slopes panel.
The Drug Effect (220) model calculates two slopes per profile.
Under Slope Calculation in the Slopes Selector panel, select Slope 1 or Slope 2.
Select Linear or Log to set the slope calculation method for slope 1 or slope 2.
Use the instructions listed above to select the start times, end times, and exclusions.
