Time-to-event observed variable tab(s) options
The options provided below are the ones for a time-to-event observed variable in a model involving categorical covariates.

Descriptions Override Main tab stratification and Quantile % can be found in the “Continuous observed variable tab(s) options” section.
The Times field allows specifying the time points used to create Kaplan-Meyer plot. It uses the same syntax as in the simulation table.
Only the first event is used to construct the plot, subsequent events are ignored.
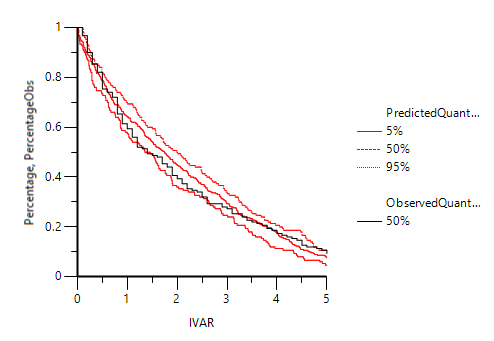
The image below shows the plot of observed fraction (depicted by the black line) and the 5%, 50%, and 95% quantiles (the default values entered in the Quantile % field) of simulated fraction (depicted by the red lines) for a time-to-event observed variable.
