The Initial Estimates tab allows viewing plots of different variables in the main input dataset and view parameters in the model. Adjust initial estimates for the fixed effects to determine the best values.
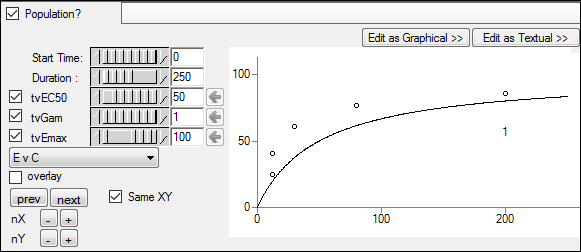
Use the pointer to move the Start Time and Duration sliders right or left to select which portion of the initial estimates timeline to view, or type values into the fields beside the sliders.
For example, if the total timeline runs from 0–50 but you want to zoom in on 35–45. Set the start time to 35 and the duration to 10.
Use the pointer to move the fixed effect slider right or left or adjust the initial estimates for each fixed effect or type the values into the field beside the fixed effect slider.
Note: When typing a decimal value, be aware that typing an initial “0” will cause the checkbox to automatically become unchecked. Either drop the initial “0” when entering the value or recheck the checkbox.
By default, the fixed effect sliders do not allow the selection of negative values. Moving the slider to the left changes the initial estimates to smaller decimal values. Clear the checkbox beside each fixed effect to allow the initial estimate to change to negative values.
If different initial estimates are selected in the Initial Estimates tab, click the Copy to initial estimates button to copy the initial estimate value to the Initial field for each parameter in the Fixed Effects tab.
If the initial estimates on the two tabs match, the Copy to initial estimates button is not available.
From the plots menu  , select the different variables, parameters, and covariates used to create the plots.
The plots available in the Initial Estimates tab change depending on the type of dataset used, the type of model selected, and any additional parameters and covariates that are selected. For example, in a one-compartment PK model with IV bolus dosing and no extra parameters or covariates, plots of C vs time, V vs time, Ke vs time, V vs C, and Ke vs C can be selected.
For C vs time plots, use the log checkbox to indicate whether the Y axis is logarithmic.
Check the overlay box to create one plot that contains all profiles.
Checking this box removes the previous, next, and trellis controls.
Use the prev and next buttons to navigate through the plots.
Check the Same XY box to use the same tick mark values on the X and Y axes.
Click nX + and - buttons to add and remove a trellis row, respectively. This displays/removes rows of extra plots in the tab.
Click nY + and - buttons to add and remove a trellis column, respectively. This displays/removes columns of extra plots in the tab.
Drag the separation bar between the upper and lower section of the Phoenix window upward to increase the size of the Initial Estimates tab and expand the plot view.
Note: If the plotting window is not refreshed after making a change to the model structure or mappings, select a different tab and then go back to the Initial Estimates tab.