This example steps through the full process of using the Phoenix IVIVC workflow to generate an in vitro in vivo correlation model and apply it to predict PK profiles from dissolution data for a new formulation.
The completed project (IVIVC_Workflow.phxproj) is available for reference in …\Examples\IVIVC.
Note: Phoenix IVIVC functionality requires a license for the Phoenix IVIVC Toolkit.
There may be multiple paths to accomplishing a step (e.g., main menu, right-click menu, drag-and-drop, etc.). For simplicity, only one is listed here.
Set up the project and data
Create a new project named IVIVC_Workflow.
Import the following files from …\Examples\IVIVC\Supporting files
In the File Import Wizard dialog, check the Has units row box for each file and press Finish.
IVIVC_Diss.csv: in vitro fraction dissolved over time for five formulations.
IVIVC_Test.csv: time-concentration profiles for individual subjects given the same formulations in IVIVC_Diss.csv.
IVIVC_Vivo_Subj.csv: in vitro fraction dissolved over time for a new, test formulation, for use in predicting PK data.
Select and smooth the dissolution data
The IVIVC object's InVitro Data panel, InVitro Formulation panel, and InVitro tab (located underneath the Setup tab) include settings to identify the dissolution data to be used in fitting an in vitro in vivo correlation, and options to smooth the dissolution data.
1. Select Workflow in the Object Browser and then select Insert > IVIVC > IVIVC.
2. Drag the IVIVC_Diss dataset from the Data folder to the InVitro Data panel to map it as the input source.
3. Map the data types to the contexts as follows:
Time to InVitro Time
Formulation to InVitro Formulation
Fdiss to InVitro Dissolution
4. Select InVitro Formulation from the Setup list and map the data types as follows:
CR01, CR02, and CR04 to Internal (These formulations are used to fit the IVIVC.)
CR03 to External (It is used to validate the IVIVC in the Correlation tab.)
Leave Targ mapped to None as the target formulation provides the comparator for predictions made in the Prediction tab.
Note: Mapping the Formulation Partitioning dataset enables dissolution data partitioning, which identifies the formulations that are used for IVIVC fitting and testing.
5. In the InVitro tab, below the Setup tab, select the Weibull option under Dissolution Model.
6. Select InVitro Estimates in the Setup list.
7. For the FINF (fraction absorbed extrapolated to time infinity) parameter for each formulation, select Fixed in the Fixed or Estimated column to set its initial value.
8. Enter 1 in the Initial column for the FINF parameter for each formulation.
9. Enter 0 in the Initial column for the TLAG and INT parameters for each formulation, if necessary.
10. In the InVitro tab, press Fit Dissolution Data to fit the Weibull model and generate smoothed data for each subject (press OK in the completion popup).
Fit the unit impulse response and estimate absorption
The InVivo Data panel and InVivo tab support identification of in vivo PK data, fitting of the unit impulse response (UIR) function, and provide an estimation of the fraction of drug absorbed over time, based on the UIR and PK data.
1. In the Setup list, select InVivo Data.
2. Drag the IVIVC_Vivo_Subj worksheet from the Data folder to the InVivo Data panel.
Map Time to the Independent context.
Map Subj to the Sort context.
Map Form to the InVivo Formulation context.
Map Cp to the Values context.
3. Select the InVivo Dosing in the Setup list.
4. Set the dose for each formulation to a value of 1.
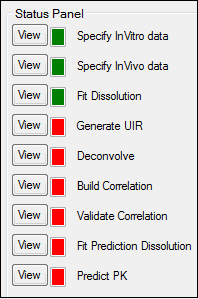
Look at the Status Panel in the lower right corner of the window. Note that the top three squares in the panel are now green, indicating that those steps have been completed (red indicates an incomplete step).

5. Select the InVivo tab, which is located below the Setup tab.
6. Leave the Maximum number of UIR exponentials menu set to 3.
7. Select IV from the Reference Formulation menu.
8. Press Generate UIR to fit the model and generate predicted data for each subject (press OK in the completion popup).
9. Press Deconvolve.
Phoenix deconvolves PK subject data with the newly fitted UIRs to estimate the fraction of the drug absorbed over time for each subject (press OK in the completion popup).
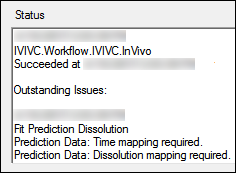
Select the Status tab, below the Setup tab, to see the status of each step of the IVIVC workflow. If a step fails, the Status tab displays information concerning why the step failed.

Develop and validate the IVIVC model
Now that smoothed dissolution data and estimated absorption data are available, they can be used to fit and test a correlation model.
1. Select the Correlation tab, below the Setup tab.
2. Select the Fabs=AbsScale*Diss(Tscale*Tvivo) option button, if it is not selected.
3. Press Build Correlation (press OK in the completion popup).
Phoenix fits the model to the dissolution and absorption data and generates parameters and predicted data. The Results tab displays the Correlation Step worksheets, plots, and text output.
4. In the Correlation tab, select Linear_Trapezoidal_Linear_Interpolation from the Calculation Method menu, if it is not already selected.
5. Press Validate Correlation (press OK in the completion popup).
Phoenix performs a noncompartmental analysis on the predicted and observed PK data, averages the AUC and Cmax for each formulation, and displays the percentage of error and the ratio of the predicted to observed data as measures of prediction error.
Predict PK
Once an acceptable IVIVC model is generated, Phoenix can use it to predict PK data based on dissolution data for new formulations.
1. In the Setup list, select Prediction Data.
2 Drag the IVIVC_Test worksheet from the Data folder to the Prediction Data Mappings panel.
Map Time to the Time context.
Map Formulation to the Formulation context.
Map Fdiss to the Dissolution context.
3. Identify which formulations to use for IVIVC fit and testing by selecting Prediction Dosing in the Setup list.
Note: If an internal worksheet relies on internal data sources, such as output from part of the IVIVC workflow, then the worksheet might not be displayed.
4. Press Rebuild to create the internal worksheet.
5 Enter 1 in the Dose column.
6. In the Prediction tab, below the Setup tab, select the Weibull option button to choose the Weibull dissolution model.
7. Select Prediction Estimates in the Setup list.
8. Select Fixed in the Fixed or Estimated column to set the initial value for the FINF parameter.
9. Enter 1 in the Initial column for the FINF parameter
10. In the Prediction tab, select Targ from the Target Formulation menu.
11. Press Fit Dissolution Data to fit the model and generate smoothed data (press OK in the completion popup).
12. Press Predict PK in the Prediction tab to generate predicted PK data for each subject that exists in the original dissolution and PK datasets (press OK in the completion popup).
Phoenix uses the IVIVC model to predict absorption for each subject and then convolves that with the UIRs from the target formulation to generate PK data for each subject. Phoenix then performs noncompartmental analysis on the predicted data and compares the results to those for the target formulation selected in the InVivo Data panel. The output, shown on the Results tab, gives the prediction error versus the target formulation. The IVIVC workflow is complete when Predict PK in the Status Panel is green. The output, shown on the Results tab, gives the prediction error versus the target formulation.
Note: It is not necessary to click the Execute button. Because the IVIVC object is a series of workflows clicking the Execute button will only re-execute all the steps that have been completed, and not produce any new output.
This concludes the IVIVC Workflow example.