Creating a baseline-adjusted variable
In many cases it is useful to fit a model to a variable with some endogenous or baseline level (e.g., blood pressure or estrogen levels). The calculation of these PK parameters would generally be done on the baseline-adjusted observation values. This example will compute the change from baseline in a response variable using a column transformation. Thus creating an analysis-ready new column of data.
Import …\Examples\WinNonlin\Supporting files\endogenous.dat.
Press Finish in the File Import Wizard dialog.
Right-click Workflow in the Object Browser and select New > Data Management > Data Wizard.
In the Options tab, select Transformation as the Action and press Add.
Drag the endogenous worksheet from the Data folder to the Data Wizard 1 object Main Mappings panel.
Select Baseline as the Transformation Type in the Options tab.
Select Change from Baseline as the Transformation.
In the New Column Name field, type Change.
In the Main Mappings panel, map the data types as follows:
Time to Time
Conc to x Column
Execute the object.
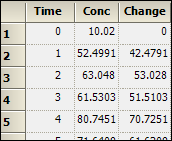
Part of the Column Transformation Result worksheet is shown below:

The Change column is added to the dataset and is ready for use in modeling.
Right-click the project and select Close Project.
This concludes the Transformations — Ratios and Baseline Adjustments example.