Crossover design supports two data formats: data for both treatments stacked in one column, or each treatment placed in a separate column. An example of each follows.
Knowledge of how to do basic tasks using the Phoenix interface, such as creating a project and importing data, is assumed.
The completed project (Crossover.phxproj) is available for reference in …\Examples\WinNonlin.
Handle data stacked in one column
For this type of data, all the data for one treatment must be displayed in the first rows, followed by all the data for the other treatment.
Create a project called Crossover.
Import the file …\Examples\WinNonlin\Supporting files\stacked.CSV.
Right-click stacked in the Data folder and select Send To > Computation Tools > Crossover.
In the Main Mappings panel, map the columns to the contexts as follows:
PARAMETER to Sort.
ESTIMATE to Response.
Leave TREATMENT mapped to Treatment.
Leave SUBJECT mapped to Subject.
Leave PERIOD mapped to None.
Leave SEQUENCE mapped to Sequence.
Click ![]() (Execute icon) to execute the object.
(Execute icon) to execute the object.
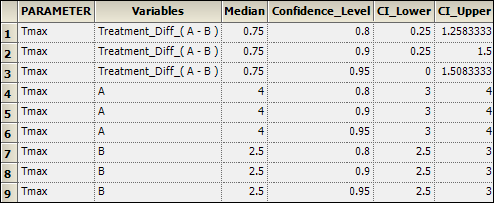
The Crossover object computes intervals for treatment medians and median difference between treatments, the results of which are displayed in the Confidence Intervals worksheet.
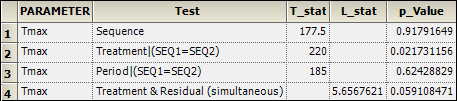
Select Effects in the Results list.
The Crossover object also estimates the relevance of direct, residual, and period effects as well as treatment and residual effects. These results are displayed in the Effects worksheet.
Handle data in separate columns
1. Import the file …\Examples\WinNonlin\Supporting files\separate.CSV.
2. Right-click separate in the Data folder and select Send To > Computation Tools > Crossover.
The treatment data layout must be specified before the data can be mapped to the contexts for the Crossover 1 object.
3. In the Options tab, select Separate from the Treatment Data Layout menu.
4. In the Main Mappings panel, map the columns to the contexts as follows:
Map trt_G to Test Treatment.
Map trt_H to Reference Treatment.
Leave Sequence mapped to Sequence.
Leave Subject mapped to Subject.
5. Execute the object.
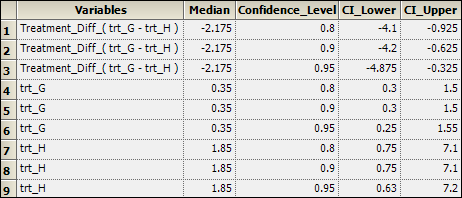
The Confidence Intervals results worksheet contains treatment medians, median differences between treatments, and intervals for those estimates.
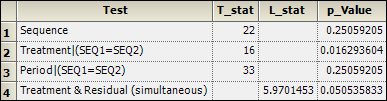
6. Select Effects in the Results list.
The Effects worksheet provides statistics for direct, residual, and period effects, as well as the effect of treatment and residual simultaneously.
This concludes the Crossover example.