Yijkt be the response of subject j in sequence i at time t with treatment k.
 be a vector of responses for subject j in sequence i. The components of Y are arranged in the ascending order of time.
 .be the design vector of treatment T in sequence i.
 be a design vector for treatment R in sequence i.
ni > 1 be the number of subjects in sequence i.
Assume the mean responses of  , follow a linear model:

where mT, mR are the population mean responses of Y with treatments T and R respectively, and Xi are design/model matrices.
Let:

be the number of occasions T is assigned to the subjects in sequence i.

be the number of occasions R is assigned to the subjects in sequence i.
Then:
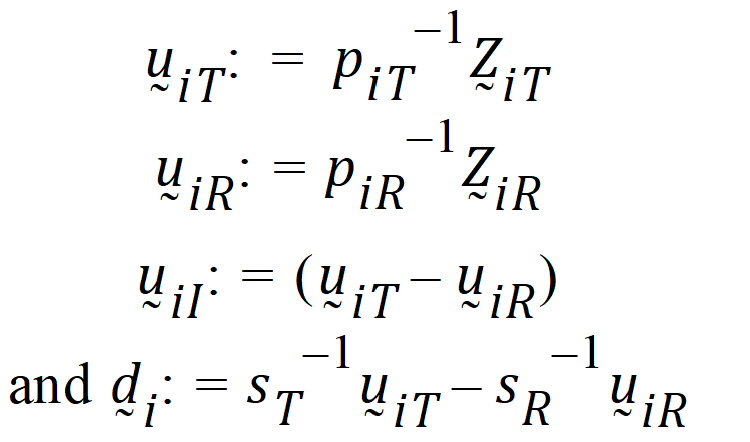
Assume that the covariances:

follow the model:

where the parameters:

are defined as follows:

intra-subject correlation coefficients are:

intra-subject covariances are:
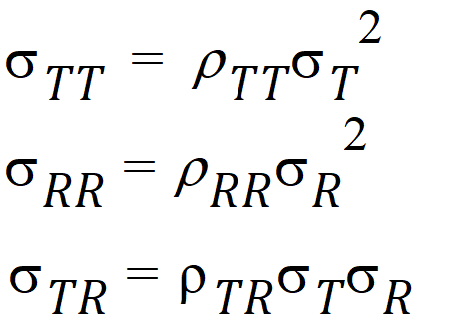
intra-subject variances are:

For PBE and IBE investigations, it is useful to define additional parameters:
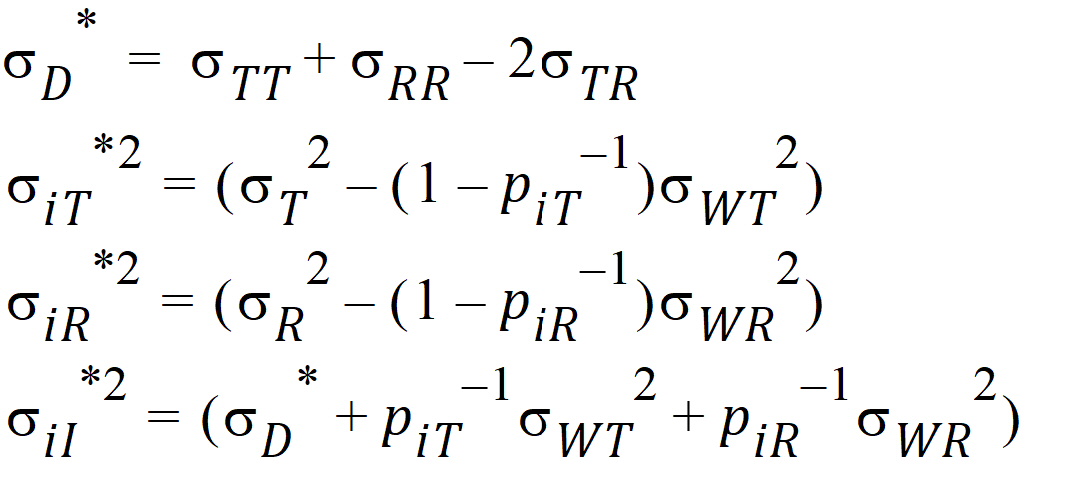
Except for sD*, all the quantities above are non-negative when they exist. It satisfies the equation:

In general, this sD* may be negative. This method for PBE/IBE is based on the multivariate model. This method is applicable to a variety of higher-order two-treatment crossover designs including TR/RT/TT/RR (the Balaam Design), TRT/RTR, or TxRR/xRTT/RTxx/TRxx/xTRR/RxTT (Table 5.7 of Jones and Kenward, page 205).
Given the ith sequence, let:
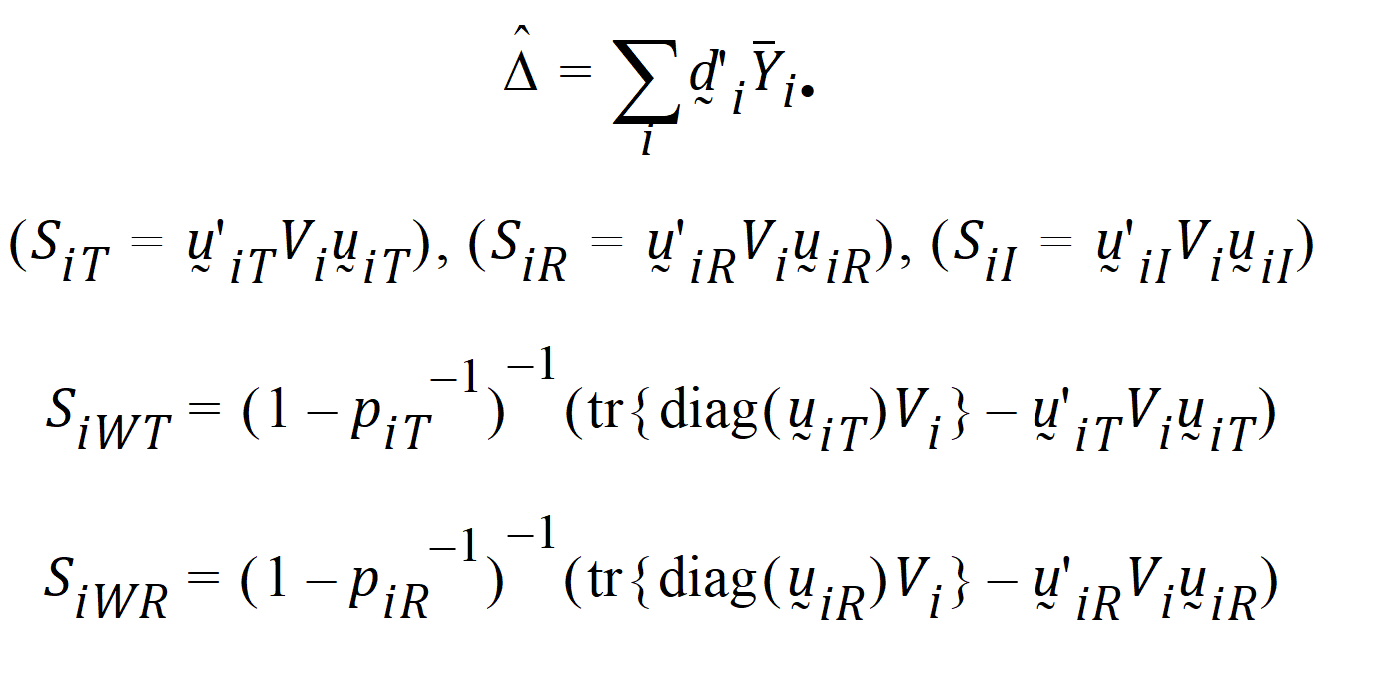
where:
 is the sample mean of the ith sequence.
Vi is the within-sequence sample covariance matrix.
It can be shown that:
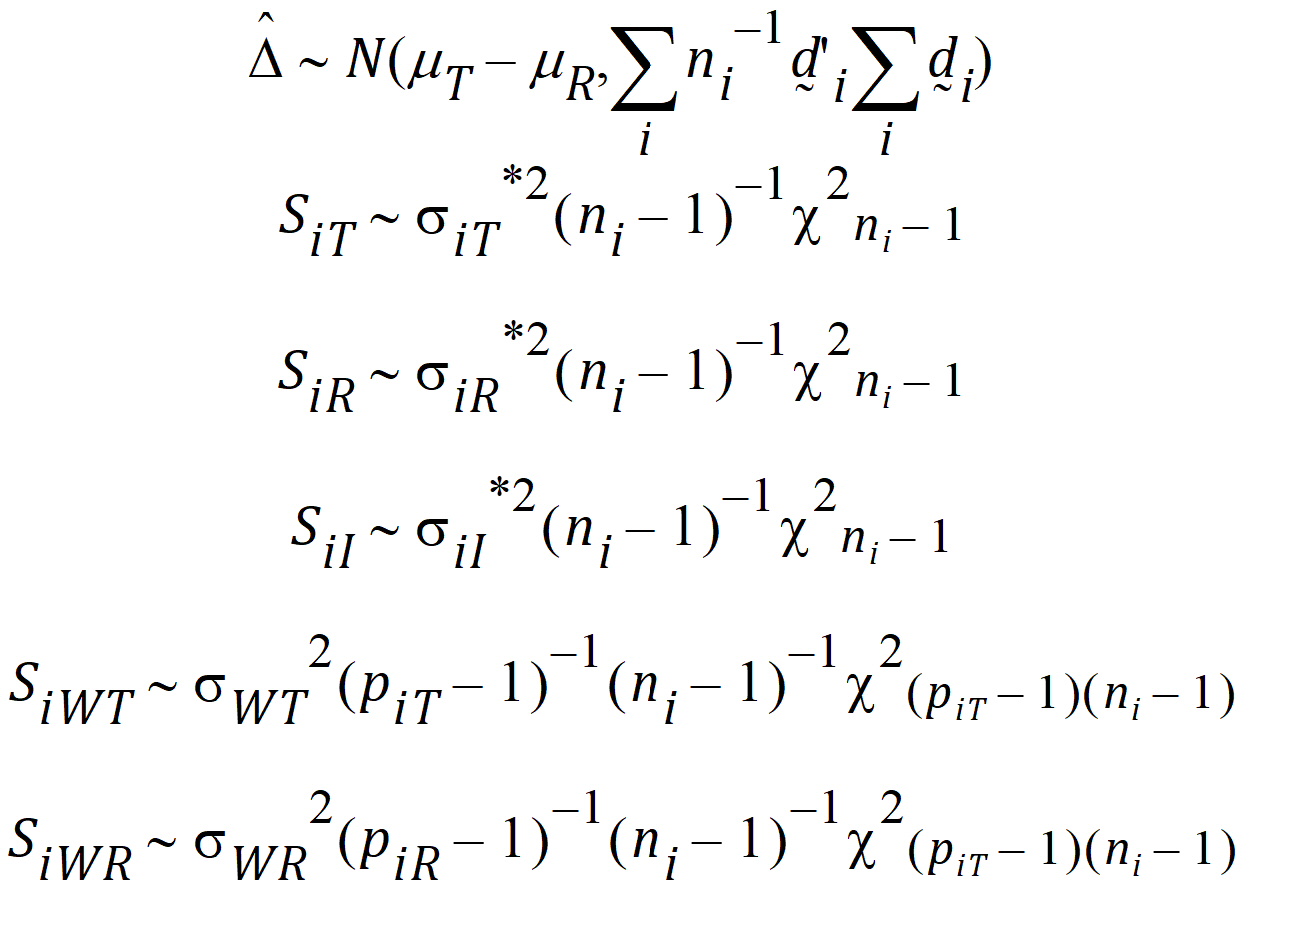
Furthermore, it can be shown that {SiT, SiR} (for PBE) are statistically independent from {D} and {SiWT, SiWR}, and that the four statistics D, SiI, SiWT, SiWR (for IBE) are statistically independent.
Let ai be sets of normalized weights, chosen to yield the method of moments estimates of the h. Then define the estimators of the components of the linearized criterion by:
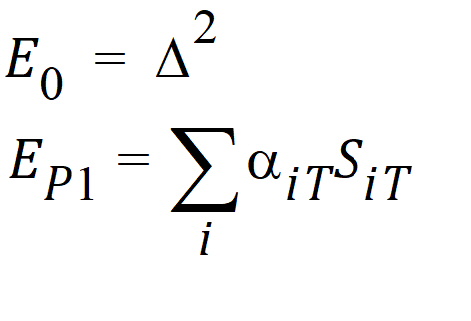


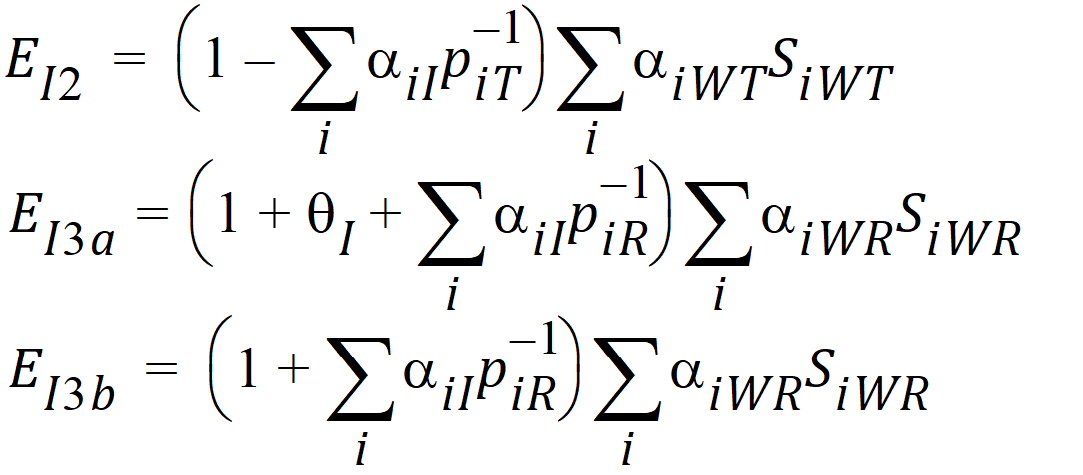
Using the above notation, one may define unbiased moment estimators for the PBE criteria:

and for the IBE criteria:

Construct a 95% upper bound for h based on the TRTR/RTRT design using Howe’s approximation I and a modification proposed by Hyslop, Hsuan and Holder (2000). This can be generalized to compute the following sets of nq, H, and U statistics:
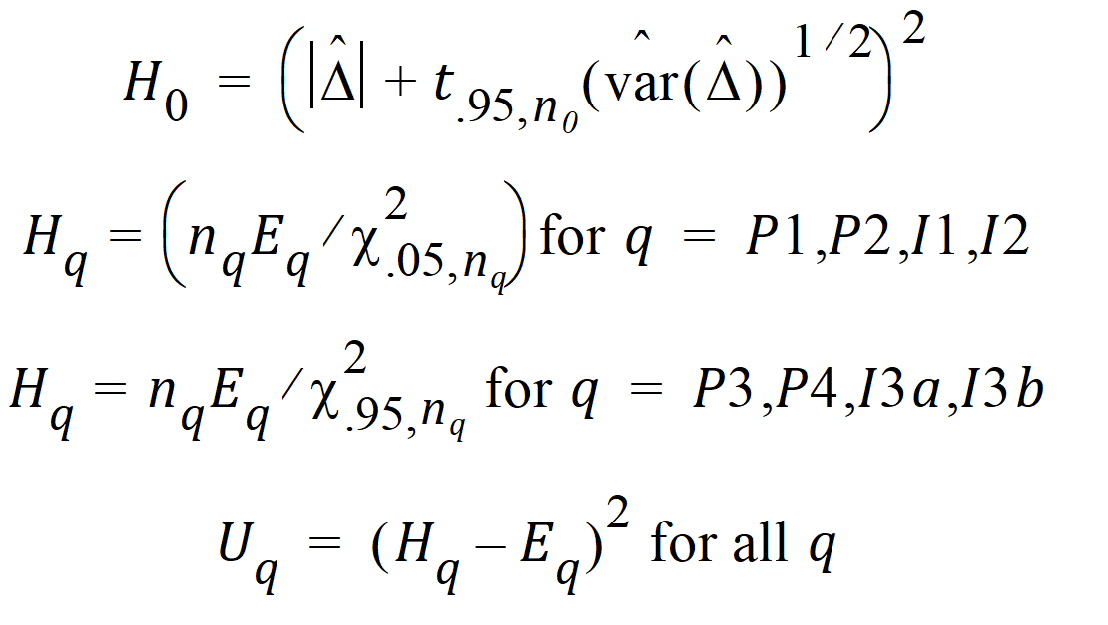
where the degrees of freedom nq are computed using Satterthwaite’s approximation. Then, the 95% upper bound for each h is:
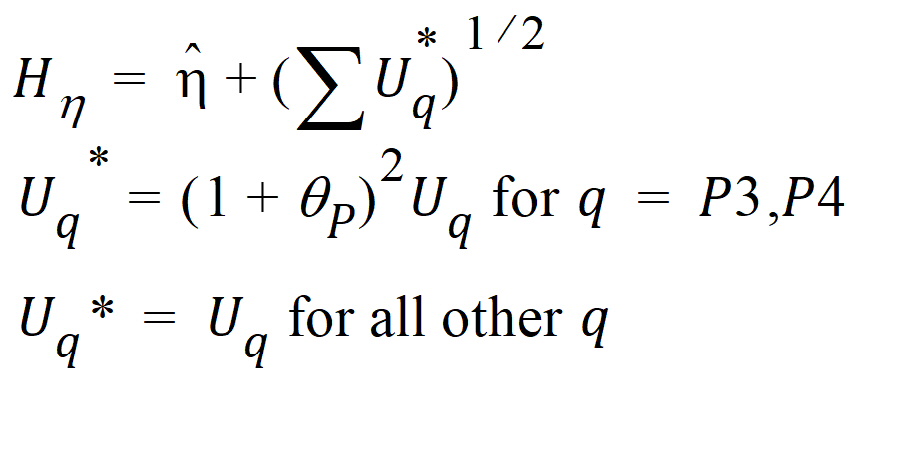
If Hq < 0, that indicates bioequivalence; Hq > 0 fails to show bioequivalence.