Create report-ready table from NCA results example
PK parameters for six subjects for both Tablet and Capsule formulations were computed.
The input data for this example are located in the Phoenix examples directory. This example will create a table using the parameters Cmax, Tmax, AUCall, and AUClast.
Most Phoenix objects require the same basic steps for their use. However, there may be multiple paths to accomplishing a step (e.g., main menu, right-click menu, drag-and-drop, etc.). For simplicity, only one is listed here.
Note:Any object added to a project can be viewed in its own window by selecting the object in the Object Browser and double-clicking it or pressing ENTER. All instructions for setting up and executing an object are the same whether the object is viewed in its own window or in Phoenix’s viewing.
The completed project (Tables.phxproj) is available for reference in …\Examples\Data and Plots.
Import the final parameter estimates data
-
Create a new project with the name Tables.
-
Import the file …\Examples\WinNonlin\Supporting files\Profiles Output.xls.
In the File Import Wizard dialog, select the Has units row option for the Final Parameters Pivoted, Dosing Used, and Summary Table worksheets, using the Next Arrow button to move through the worksheets being imported.
Click Finish.
Set up the Table object
-
Right-click Final Parameters Pivoted in the Data folder and select Send To > Reporting > Table.
-
In the Options tab below the Setup panel, select Table 3 - Column Detail and Summary by Row Stratification from the Table Type menu.
-
Map Subject to the Row ID context.
Map Form to the Stratification Row context.
Map Tmax, Cmax, AUClast, and AUCall to the Data context.
Leave the rest mapped to None.
Table type 3 sorts by the row variable within values of the stratification row variable. It does not compute summary statistics for each level of the row variable. Table type 3 also sorts the data by stratification row variable value and computes summary statistics for each value.
These variables provide data for the body of the table. (Select the Table Preview panel in the Setup list to view an example of the final table output.)
Select and format summary statistics
-
Select the Statistics tab below the Setup panel.
-
Check the checkboxes in the Display column to select the following summary statistics: N, Mean, SE, Min, Median, Max.
-
Go to the Options tab, expand the Precision/Alignment node in the menu tree, and select Subject.
-
Select 0 in the Value menu.
-
Enter a title for the table by selecting Titles in the Options menu tree.
– In the Title field type Table 1 and click Add.
– Continue by typing Pharmacokinetic Parameters in the Title field and click Add. -
Select the Column/Sort Order tab.
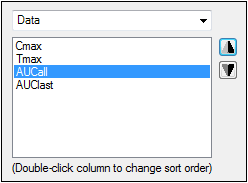
The columns in the final table are displayed in the order set here. Use the up arrow and down arrow buttons to change the order in which the Data columns are displayed.
The pull-down menu offers the following options:
Row Stratification to view study parameter(s) mapped to Row Stratification.
Row ID to view study parameter(s) mapped to Row ID.
Data to view study parameter(s) mapped to Data.
Statistics to view the items selected on the Statistics tab. -
Select Data from the menu.
-
Select Cmax in the Column Order list and click the Up Arrow button.
-
Select AUCall in the Column Order list and click Up Arrow button.

The Table object’s Style tab can be used to change the table display options, such as font, font size, font color, and alignment. Style selections are not necessary for this example.
Execute and view the Table object results
-
Click
 (Execute icon) to execute the object.

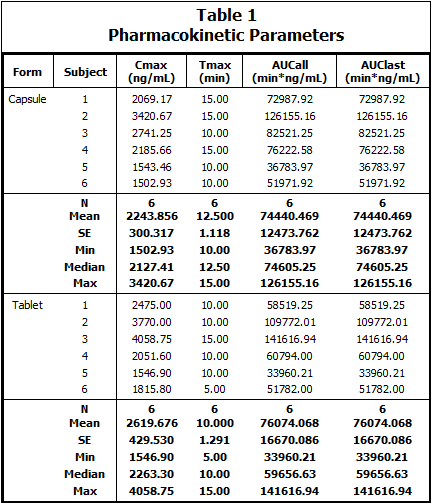
Table type 3 results
This concludes the Create Report-Ready Table example.
The custom table types are included to provide additional reporting options. In custom table types, all output formatting, statistics, styles, sorting, and other options are predefined through an XML file and style sheets.
Once a custom table is defined, users do not need to make any further option selections. The only possible selections users can make are mapping the input data types to the mapping contexts in the custom table.
Most Phoenix objects require the same basic steps for their use. However, there may be multiple paths to accomplishing a step (e.g., main menu, right-click menu, drag-and-drop, etc.). For simplicity, only one is listed here.
Note:Any object added to a project can be viewed in its own window by selecting the object in the Object Browser and double-clicking it or pressing ENTER. All instructions for setting up and executing an object are the same whether the object is viewed in its own window or in Phoenix’s viewing.
The completed project (Tables.phxproj) is available for reference in …\Examples\Data and Plots.
Add a table object using the Send To menu
This example uses a dataset that contains demographic data for a population used in a bioequivalence study.
-
From within an open project, import the file …\Examples\WinNonlin\Supporting files\Bioequivalence Demographics.dat.
-
Right-click Bioequivalence Demographics in the Data folder and select Send To > Reporting > Table.
-
Select the Custom Tables tab below the Setup panel.
-
In the Select Custom Table menu, select Bioequivalence Demographics.
All other tabs are removed from the Table object user interface when a custom table is selected. This is because the custom table type contains preconfigured table options.
The study data types are automatically mapped to the appropriate mapping contexts.
Execute and view the results
-
Execute the object.
-
Close this project by right-clicking the project and selecting Close Project.

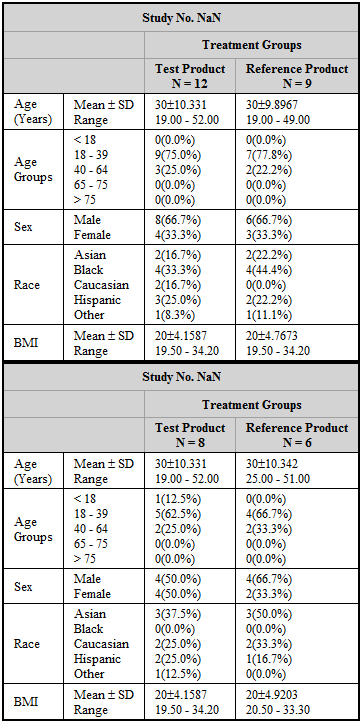
Bioequivalence Demographics table results
This concludes the Using Custom Tables example.
