This section contains step-by-step instructions for creating and executing a variety of third party tool projects.
Completed projects for these examples are available for reference in …\Examples\PsN. You can save a copy of the Examples directory (installed with Phoenix) to your Phoenix project directory via the Project Settings in the Phoenix Preferences dialog.
Note:All of these examples assume that the path to the psn.conf file has already been specified in Phoenix. (Select Edit > Preferences > PsN and enter/browse to the psn.conf file.)
Note:If all of the appropriate paths are set in this file (perl.exe, PsN utilities, R), Phoenix will populate the appropriate paths in this dialog. The available NONMEM configurations from psn.conf will be displayed for selection in the Options tab in the -nm_version pull-down.
PsN Shell object setup and execution example
Using shortcuts with the PsN Shell object
Using PsN Shell and R Shell objects to generate GOF and individual plots
Using PsN Shell and R Shell objects to generate VPC plots
PsN Shell object setup and execution example
The completed project (Ex01_PsN_Execute.phxproj) is available for reference in …\Examples\PsN.
Set up the project and data
-
Create a new project named Ex01_PsN_Execute.
-
Import THEOPP.dat and the PsN control file psn.ctl from …\Examples\PsN\Example1.
-
In the File Import Wizard dialog, click Finish.
The THEOPP file is added to the project’s Data folder and the psn.ctl control file is added to the Code folder.
Set up the PsN Shell object
-
Select Workflow in the Object Browser and then select Insert > External Software > PSN Shell.
-
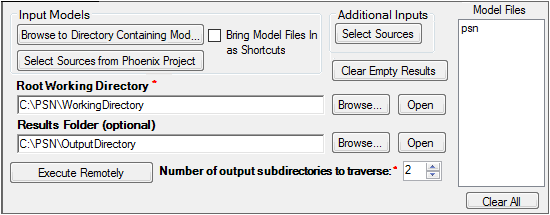
In the Options tab, click the Select Sources from Phoenix Project button.
-
In the Select Sources dialog, expand the Code folder, check the box for psn, and then click OK to specify the input model.
-
Click THEOPP in the Setup list, then drag the dataset THEOPP from the Data folder to the Mappings panel.
-
Specify the root working directory by typing the path to the desired folder in the Root Working Directory field or use the Browse button.
This is where PsN will create run directories for each command executed (i.e., execute, bootstrap, etc.), so you must have write permission for the selected folder.
Execute the PsN Shell object
-
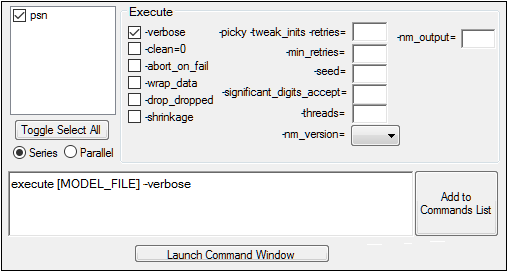
Click the Execute tab and build a command with the available command line options.
Make sure the psn checkbox is checked in the model list.
Check the -verbose checkbox. -
Click Add to Commands List when finished building the command.
-
Click
 (Execute icon) to execute the object.
This concludes the PsN Shell object setup and execution example. You may save the project, if you wish, or simply close it.
Using shortcuts with the PsN Shell object
The completed project (Ex02_PsN_ExecuteWithShortcut.phxproj) is available for reference in …\Examples\PsN.
The example control file is set up to look for the dataset source in C:\temp, so do either of the following:
Copy the THEOPP file from the …\Examples\PsN\ExampleWithShortcut folder to C:\temp.
Or
Edit the model_file_with_shortcut.ctl file if another location is desired.
Set up the project and data
-
Create a new project named Ex02_PsN_ExecuteWithShortcut.
-
Select Workflow in the Object Browser and then select Insert > External Software > PsN Shell.
-
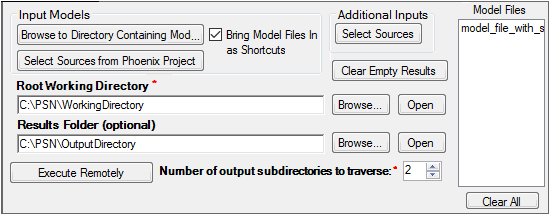
In the Options tab, check the Bring Model Files in as Shortcuts box.
-
Click the Browse to Directory Containing Model Files button and navigate to and select …\Examples\PsN\ExampleWithShortcut, then click OK.
A link to the model_file_with_shortcut.ctl control file is added to the Shortcuts folder in the Phoenix project. A new item also appears in the Object list: model_file_with_shortcut. -
Specify the root working directory, if one has not been specified already via the Preferences dialog, by typing in the path to the desired folder in the Root Working Directory field or use the Browse button. You must have write permission for the selected folder.
Execute the PsN Shell object
-
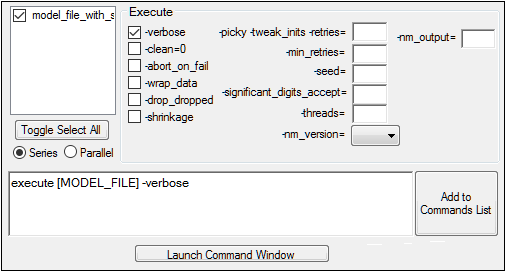
Click the Execute tab and build a command with the available command line options.
Make sure the model_file_with_shortcut checkbox is checked in the model list.
Check the -verbose checkbox. -
Click Add to Commands List when finished building the command.
-
Execute the object.
This concludes the “Using shortcuts with the PsN Shell object” example. You may save the project, if you wish, or simply close it.
Using PsN Shell and R Shell objects to generate GOF and individual plots
This example involves the Xpose package for R. Make sure that this package is installed for R (http://xpose.sourceforge.net/docs_install.php).
The Xpose package uses the following tables (* is the run number):
sdtab* file (i.e., standard table file): This file contains columns such as ID, DV, PRED, IPRED, WRES, IWRES, RES, IRES, etc.
patab* file: This is a parameter table containing model parameters: THETAs, ETAs and EPSes. The correspondences between ETA and THETA can be defined within Xpose. EPS is optional in this table, it is mainly used to generate the parameter vs parameter plots and parameters vs covariates plots.
catab* Categorical covariates, e.g. SEX, RACE
cotab* Continuous covariates, e.g. WT, AGE
extra*, mutab*, mytab*, xptab*: Other variables that might be needed by Xpose (Xpose 4 and above can postulate all the other values from one table (mytab1), but it is always safer to have these plots).
cwtab*: The cwtab file is generated by Xpose. In NONMEM 7, the calculation of CWRES is built in.
run*.mod: Model specification file
run*.lst: NONMEM output
The completed project (Ex03_PsN_Xpose_GOF.phxproj) is available for reference in …\Examples\PsN.
Set up the project and data
-
Create a new project named Ex03_PsN_Xpose_GOF.
-
Import the PsN control file nm_final.ctl and the dataset file example.csv from …\Examples\PsN\Xpose_GOF_IND.
-
In the File Import Wizard dialog, click Finish.
Set up the PsN Shell object
-
Select Workflow in the Object Browser and then select Insert > External Software > PsN Shell.
-
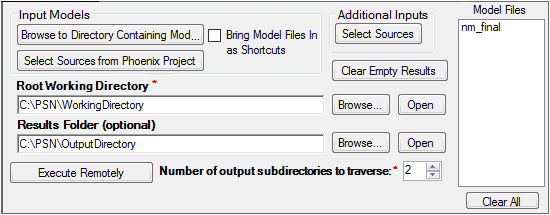
In the Options tab, click the Select Sources from Phoenix Project button.
-
In the Select Sources dialog, expand the Code folder, check the box for nm_final, and then click OK.
A new item appears in the Object list, nm_final, and a dataset input is now available to the PsN shell, based on the dataset name in the control file (“example.csv”). -
In the Setup tab list, click EXAMPLE.CSV.
-
Drag the example worksheet from the Data folder to the Mappings panel.
-
Specify the root working directory by typing the path to the desired folder in the Root Working Directory field or use the Browse button. You must have write permission to the selected folder.
-
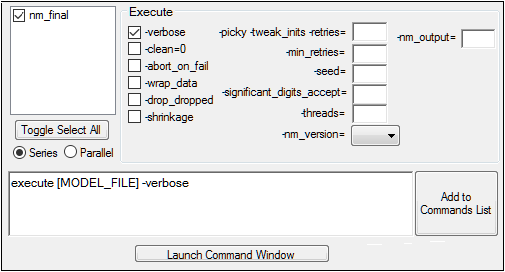
Go to the Execute tab and build a command with the available command line options.
Make sure the nm_final checkbox is checked in the model list.
Check the -verbose checkbox. -
Click Add to Commands List when finished building the command.
-
Execute the object.
-
Import the R command file Xpose_GOF_IND.R from …\Examples\PsN\Xpose_GOF_IND.
-
Right-click Xpose_GOF_IND in the Code folder and select Send To > External Software > R Shell.
An R Shell object is now in the workflow and has focus. -
Specify the location to store results by typing the path to the desired folder in the R Results Folder field or use the Browse button. You must have write permission for the selected folder.
-
Click the Select Sources button on the Options tab and navigate to Workflow > PsN Shell > Text Output.
-
Check the boxes for catab1, cotab1, patab1, and sdtab1, then click OK.
-
Execute the R Shell and observe the goodness-of-fit and individual plots generated by Xpose.
This concludes the “Using PsN Shell and R Shell objects to generate GOF and individual plots” example. You may save the project, if you wish, or simply close it.
Using PsN Shell and R Shell objects to generate VPC plots
This example involves the Xpose package for R. Make sure that this package is installed for R (http://xpose.sourceforge.net/docs_install.php).
The completed project (EX04_PsN_Xpose_VPC.phxproj) is available for reference in …\Examples\PsN.
Set up the project and data
-
Create a new project named Ex04_PsN_Xpose_VPC.
-
Import the PsN control file nm_final.ctl and the dataset file nonmem.csv from …\Examples\PsN\Xpose_VPC.
In the File Import Wizard dialog, click Finish.
Set up the PsN Shell object
-
Select the workflow in the Object Browser and then select Insert > External Software > PsN Shell.
-
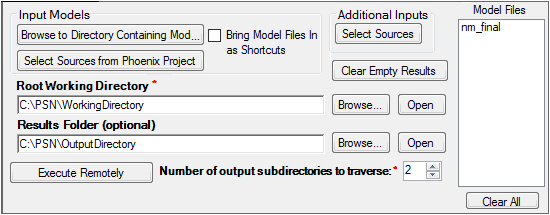
In the Options tab, click Select Sources from Phoenix Project.
-
In the Select Sources dialog, expand the Code folder, check the box for nm_final, and then click OK.
-
In the Object list in the Setup tab, click NONMEM.CSV.
-
Use the mouse pointer to drag the nonmem worksheet from the Data folder to the Main Mappings.
-
Specify the root working directory by typing the path to the desired folder in the Root Working Directory field or use the Browse button. You must have write permission for the selected folder.
-
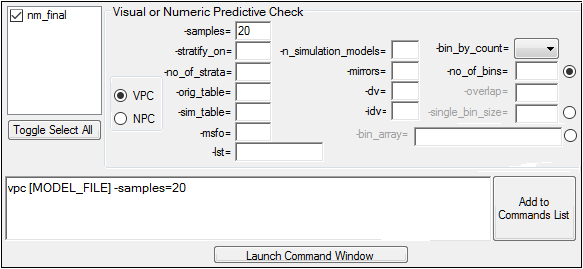
Go to the VPC tab and build a command with the available command line options.
Make sure the nm_final checkbox is checked in the model list.
Keep the -samples option set to 20. -
Click Add to Commands List when finished building the command.
-
Go to the Result Filters tab.
-
Type vpc_results.csv in the field and click Add.
-
Set the Import Format pull-down to Import as Binary.
-
Execute the object.

Set up the R Shell object
-
Import the R command file Xpose_VPC.R from …\Examples\PsN\Xpose_VPC.
-
Right-click Xpose_VPC in the Code folder and select Send To > External Software > R Shell.
-
Click the Select Sources button on the Options and navigate to Workflow > PsN Shell.
-
In the Text Output folder, check the box for vpctab.
-
In the Other folder, check the box for vpc_results, then click OK.
-
Execute the R Shell object and observe the VPC plots generated by Xpose.
This concludes the “Using PsN Shell and R Shell objects to generate VPC plots” example. You may save the project, if you wish, or simply close it.
