This example demonstrates how to model with sparse sampling. The time-concentration data is provided in SparseSamplingChaioYeh.xls. The dosing and therapeutic response data are stored in SparseSamplingChaioYeh_sources.xls. These files are located in the Phoenix examples directory.
The completed project (NCA_SparseSampling.phxproj) is available for reference in …\Examples\WinNonlin.
Set up the NCA object
-
Create a project called NCA_SparseSampling.
-
Import the two files …\Examples\WinNonlin\Supporting files\SparseSamplingChaioYeh.xls and SparseSamplingChaioYeh_sources.xls.
In the File Import Wizard dialog, select the Has units row option for Sheet 1 and Dosing worksheets. -
Select Workflow in the Object Browser and then select Insert > NonCompartmental Analysis > NCA.
-
Rename the NCA object just added as SparseSamplingChaioYeh.
-
Drag the SparseSamplingChaioYeh worksheet from the Data folder to the SparseSamplingChaioYeh object’s Main Mappings panel. Map the context as follows:
Subject set to None context
Time to Time context
Conc to Concentration context
Set up for sparse sampling
-
Select Dosing in the Setup list.
-
Expand the SparseSamplingChaioYeh_sources item in the Object Browser Data folder and drag the Dosing item to the Dosing panel.
Type is already mapped to the None context.
Dose is already mapped to the Dose context.
Time is already mapped to the Time context. -
Select Therapeutic Response in the Setup list.
-
In the expanded SparseSamplingChaioYeh_sources item in the Object Browser Data folder, drag the TherapeuticResponse item to the Therapeutic Response panel.
Lower is already mapped to the Lower context. -
In the Options tab, check the Sparse check box.
Execute and view the NCA results
All necessary settings are complete.
-
Click
 (Execute icon) to execute the object.
 -
In the Results tab, click Final Parameters.
-
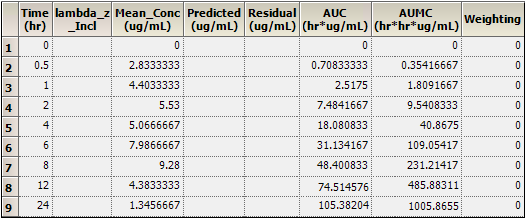
Click Summary Table.
-
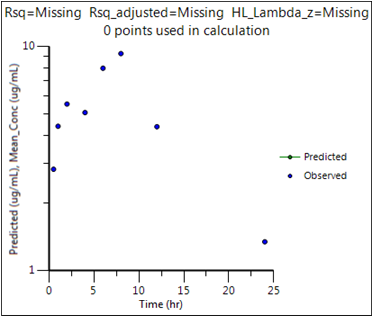
Click Observed Y and Predicted Y vs X.
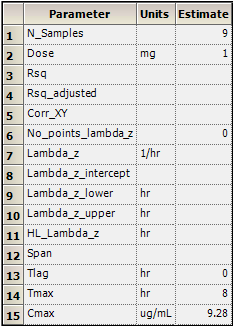
Part of the Final Parameters worksheet
This concludes the sparse sampling example.
