This example demonstrates how to model a urine study. The time range, concentration, and data are provided in nca_pd.xls. The dosing data are stored in nca_pd_sources.xls. These files are located in the Phoenix examples directory.
The completed project (NCA_DrugEffect.phxproj) is available for reference in …\Examples\WinNonlin.
Set up the NCA object
-
Create a project called NCA_DrugEffect.
-
Import the two files …\Examples\WinNonlin\Supporting files\nca_pd.xls and nca_pd_sources.xls.
In the File Import Wizard dialog, select the Has units row option for Sheet 1. -
Select Workflow in the Object Browser and then select Insert > NonCompartmental Analysis > NCA.
-
Rename the NCA object just added as nca_pd.
-
In the Options tab, set the Model Type to Drug Effect (220).
-
Drag the nca_pd worksheet from the Data folder to the nca_pd object’s Main Mappings panel to map it as the input source.
Map Time to the X context.
Map Cortisol_RR to the Y context. -
Select Dosing in the Setup list.
-
Expand the nca_pd_sources item in the Object Browser Data folder and drag the Dosing item to the Dosing panel.
Type is already mapped to the None context.
Time is already mapped to the Time context. -
Select Partial Areas in the Setup list.
-
In the expanded nca_pd_sources item in the Object Browser Data folder, drag the PartialAreas item to the Partial Areas panel.
Map Curve to the Area # context.
Map Lower to the Start Time context.
Map Upper to the End Time context. -
Select Parameter Names in the Setup list.
-
In the expanded nca_pd_sources item in the Object Browser Data folder, drag the Names item to the Parameter Names panel.
Map Name to the Parameter Name context.
Leave Preferred mapped to the Preferred context.
Map Include to the Include in Workbook context. -
Select Slopes in the Setup list and enter the following information:
For the first row:
60 for Start Time
67 for End Time
Time Range for Fit Method
Linear for Lin/Log
For the second row:
125 for Start Time
133 for End Time
Time Range for Fit Method
Linear for Lin/Log -
Select Therapeutic Response in the Setup list, check the Use Internal Worksheet box and enter the following information:
2.5 for Baseline
5 for Threshold -
Click
 (Execute icon) to execute the object.
 -
In the Results tab, click Final Parameters.
-
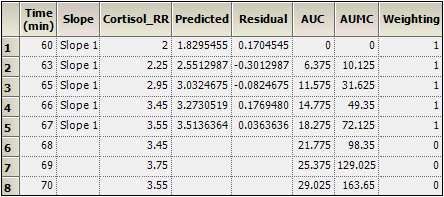
Click Summary Table.
Execute and view the NCA results
All necessary settings are complete.
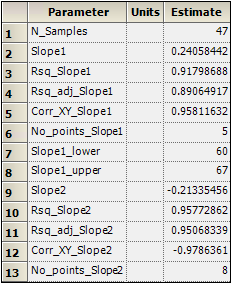
Part of the Final Parameters worksheet
This concludes the drug effect example.
