Ratios and baseline adjustments example
This example demonstrates some frequently used calculations, including:
Computing ratios
Creating a baseline-adjusted variable
Most Phoenix objects require the same basic steps for their use. However, there may be multiple paths to accomplishing a step (e.g., main menu, right-click menu, drag-and-drop, etc.). For simplicity, only one is listed here.
Note:Any object added to a project can be viewed in its own window by selecting the object in the Object Browser and double-clicking it or pressing ENTER. All instructions for setting up and executing an object are the same whether the object is viewed in its own window or in Phoenix’s viewing.
The completed project (Transformations.phxproj) is available for reference in …\Examples\Data and Plots.
Phoenix can compute derived parameters as ratios of modeling output parameters. This functionality has been designed specifically for the computation of F (fraction of oral dose absorbed) and for the calculation of metabolite to parent drug ratios.
This example will demonstrate the computation of F. Metabolite to parent drug ratios would be calculated in the same manner.
Two datasets are needed for this example: one with AUC from IV data for 24 subjects, and another with AUC from oral data from the same 24 subjects. These datasets are provided in the Phoenix example subdirectory as IV.csv and Oral.csv. During the following steps, these datasets will be merged into one dataset, F will be computed for each subject, followed by calculations of the summary statistics for F.
-
Create a new project named Transformations.
-
Import …\Examples\WinNonlin\Supporting files\IV.csv and Oral.csv.
-
Click the Next Arrow button and then click Finish in the File Import Wizard dialog.
-
Right-click the IV in the Data folder and select Send To > Data Management > Join Worksheets.
-
In the Mappings panel, map the data types as follows:
Subject to the Sort context.
Form to the Source Column context.
AUC to the Source Column context. -
Select Worksheet 2 in the Setup list.
-
Drag the Oral worksheet from the Data folder to the Worksheet 2 Mappings panel.
-
Map the data types as follows:
Subject to the Sort context.
Form to the Source Column context.
AUC to the Source Column context. -
Click
 (Execute icon) to execute the object.

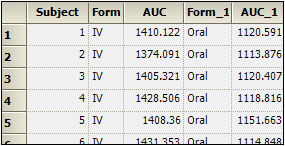
Portion of Join Worksheets Result worksheet
Calculate F (fraction of oral dose absorbed).
-
Right-click Workflow in the Object Browser and select New > Data Management > Data Wizard.
-
In the Options tab, select Transformation from the Action menu.
-
Click the Add button.
-
In the Mappings panel for the Data Wizard (Step 1: Transformation), click
 (Select Source icon).
 -
In the dialog, select the Join Worksheets object’s Result worksheet and click OK.
-
Arithmetic is automatically selected in the Transformation Type menu. Do not change this setting.
-
Select x/y in the Transformation menu.
-
In the New Column Name field type Fraction.
-
Map the data types as follows:
AUC_1 to the y Column context.
AUC_2 to the x Column context. -
Execute the object.
Calculate descriptive statistics
-
Right-click Workflow in the Object Browser and select New > Computation Tools > Descriptive Statistics.
-
Click the Select Source icon.
-
Select the Data Wizard object’s Result worksheet and click OK.
-
Map the data types as follows:
Fraction to the Summary context.
Leave all other data types mapped to None. -
In the Options tab, check the Confidence Intervals and Number of SD Statistics checkboxes, but do not change the default values for these two items.
-
Check the Other Statistics checkbox.
-
Execute the object.
The Statistics worksheet results are shown below:


Creating a baseline-adjusted variable
In many cases it is useful to fit a model to a variable with some endogenous or baseline level, for example, blood pressure or estrogen levels. The calculation of these PK parameters would generally be done on the baseline-adjusted observation values. This example will compute the change from baseline in a response variable, creating an analysis-ready new column of data.
Compute the change from baseline using a column transform.
-
Import …\Examples\WinNonlin\Supporting files\endogenous.dat.
Click Finish in the File Import Wizard dialog. -
Right-click Workflow in the Object Browser and select New > Data Management > Data Wizard.
-
In the Options tab, select Transformation as the Action and click Add.
-
Drag the endogenous worksheet from the Data folder to the Data Wizard 1 object Main Mappings panel.
-
Select Baseline in the Transformation Type menu on the Options tab.
-
Select Change from Baseline in the Transformation menu.
-
In the New Column Name field type Change.
-
In the Main Mappings panel, map the data types as follows:
Time to the Time context.
Conc to the x Column context. -
Execute the object.
-
Right-click the project and select Close Project.

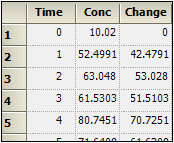
Part of Column Transformation Result worksheet
The Change column is added to the dataset and is ready for use in modeling.
This includes the Transformations — Ratios and Baseline Adjustments example.
