The NCA object provides special methods to analyze concentration data with few observations per subject. The NCA object treats this sparse data as a special case of plasma or urine concentration data. It first calculates the mean concentration curve of the data, by taking the mean concentration value for each unique time value for plasma data, or the mean rate value for each unique midpoint for urine data. For this reason, it is recommended to use nominal time, rather than actual time, for these analyses. The standard error of the data is also calculated for each unique time or midpoint value.
Using the mean concentration curve, the NCA object calculates all of the usual plasma or urine final parameters listed under “NCA parameter formulas”. In addition, it uses the subject information to calculate standard errors that will account for any correlations in the data resulting from repeated sampling of individual animals.
The NCA sparse methodology calculates PK parameters based on the mean profile for all the subjects in the dataset. For batch designs, where multiple time points are measured for each subject, this methodology only generates unbiased estimates if equal sample sizes per time point are present. If this is not the case, then bias in the parameter estimates is introduced.
Note:In order to create unbiased estimates, the sparse sampling routines used in the NCA object require that the dataset does not contain missing data.
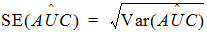
For plasma data (models 200–202), the NCA object calculates the standard error for the mean concentration curve’s maximum value (Cmax), and for the area under the mean concentration curve from dose time through the final observed time (AUCall). Standard error of the mean Cmax will be calculated as the sample standard deviation of the y-values at time Tmax divided by the square root of the number of observations at Tmax, or equivalently, the sample standard error of the y-values at Tmax. Standard error of the mean AUC will be calculated as described in Nedelman and Jia (1998), using a modification in Holder (2001), and will account for any correlations in the data resulting from repeated sampling of individual animals. Specifically:
Since AUC is calculated by the linear trapezoidal rule as a linear combination of the mean concentration values,
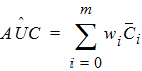
where:
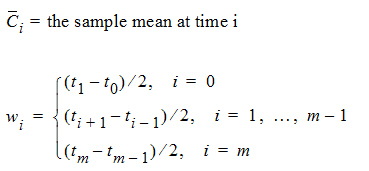
m=last observation time for AUCall, or time of last measurable (positive) mean concentration for AUClast
it follows that:
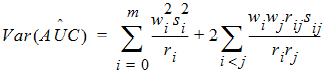
where:
rij = number of animals sampled at both times i and j
ri = number of animals sampled at time i
si2 = sample variance of concentrations at time i
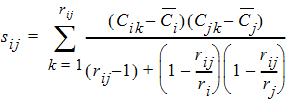
sij = sample covariance between concentrations cik and cjk for all animals k that are sampled at both times i and j
The above equations can be computed from basic statistics, and appear as equation (7.vii) in Nedelman and Jia (1998). When computing the sample covariances in the above, NCA uses the unbiased sample covariance estimator, which can be found as equation (A3) in Holder (2001):
For urine models (models 210–212), the standard errors are computed for Max_Rate, the maximum observed excretion rate, and for AURC_all, the area under the mean rate curve through the final observed rate.
For cases where a non-zero value C0 must be inserted at dose time t0 to obtain better AUC estimates (see “Data checking and pre-treatment”), the AUC estimate contains an additional constant term: C*=C0(t1 – t0)/2. In other words, w0 is multiplied by C0, instead of being multiplied by zero as occurs when the point (0,0) is inserted. An added constant in AÛC will not change Var(AÛC), so SE_AUClast and SE_AUCall also will not change. Note that the inserted C0 is treated as a constant even when it must be estimated from other points in the dataset, so that the variances and covariances of those other data points are not duplicated in the Var(AÛC) computation.
For the case in which rij=1, and ri=1 or rj=1, then sij is set to 0 (zero).
The AUCs must be calculated using one of the linear trapezoidal rules. Select a rule using the instructions listed under “Options tab”.
