The steady-state flag indicates whether the associated dose is a steady-state dose. When an observed dose is flagged as a steady-state dose, this dose is assumed preceded by a series of dose cycles given at certain regular time intervals such that they have reached steady state (i.e., PK equilibrium). The doses preceding the observed dose have not been captured in the dataset and thus the information has to be entered. The steady-state flag and the 'implied' dosing information indicate to the program that the formulas to be used need to compute the steady-state amounts at the time the steady-state dose is introduced.
The steady-state flag needs to be numeric:
•Values of zero or blank indicate that the record is simply an ordinary dose.
•Values greater than zero indicate that prior to giving the indicated dose, the PK model is put into steady state.
When a record is flagged as being at steady state the program needs some additional information about the dosing cycle when this steady-state observation was taken. Checking the Steady State checkbox in the Input Options tab adds a SteadyState column in the Main and Dosing mappings panels and a Steady State sub-menu in the tab for entering the additional dosing information is displayed.
Dosepoint/Dosepoint2: The mode of administration (either bolus or infusion) and the name of the compartment in which the dose is administered (e.g., default name 'Aa' for a one-compartment oral administration). The user must enter this dosepoint name, therefore, the name needs to exist in the model. All available dosepoint names will be listed in the Main mappings panel.
Amount: The dose amount given at each time interval during the cycle. If the amount can be entered manually and is assumed constant during a dosing cycle, then the Constant button should be selected and the dose amount entered. If the dosing cannot be assumed constant or the user wishes to enter it from an input file, then click on the toggle button, select Column, and enter the name of the column that contains this information. Ensure that this column (containing steady-state dose amounts) exists in the input dataset that contains the dose information for the observed record.
Rate/Duration: If the dosepoint route of administration is selected as an Infusion, then a rate or duration of infusion needs to be provided. This value should be a positive number and the units should be in accordance to time units in the input dataset.
If the rate/duration of infusion is assumed constant during a dosing cycle then the Constant button should be selected and rate/duration entered in the field. If the value cannot be assumed constant or the user wishes to enter it from an input file, then click on the toggle button to select Column and enter the name of the column containing this information. Ensure that this column (which contains the rate/duration of infusion) exists in the input dataset that contains the dose information for the observed record.

Delta Time: The time interval between doses that allowed steady state to be reached. If the elapsed time between 'implied' doses can be assumed constant during a dosing cycle then the Constant button should be selected and the time interval typed in the field. If the delta time cannot be assumed constant or if the user wishes to enter it from a file, then click on the toggle button to select Column and enter the name of the column that contains this information. Ensure that this column (containing steady-state delta time) exists in the input dataset that contains the dose information for the observed record.
The dosing cycle can contain multiple steps and doses to multiple compartments. This is specified by adding segments to the cycle, by clicking the Add button. The total length of the cycle is the sum of the Delta Time parts of each segment. In steady state, in each segment of the cycle, the dose occurs first, followed by the delta time.
Only numeric values or blanks are accepted in columns mapped to SteadyState. A value of zero or blank indicates that the observation is NOT collected at steady state. Any other value indicates that the model is put into steady state before administering the dose on that row.
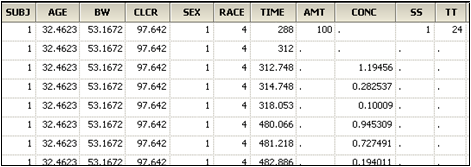
Example: The selections for steady state depicted below indicate that an infinite number of bolus doses are assumed added to the amount in the absorption compartment in the model (Aa) for that subject, in the amounts provided in the AMT column in the dataset, at time intervals provided in the TT column in the dataset. Therefore, for Subject 1, the data are assumed collected at steady state following a dosing regimen of 100 oral units every 24 hours, with the most recent dose administered 24 hours ago.


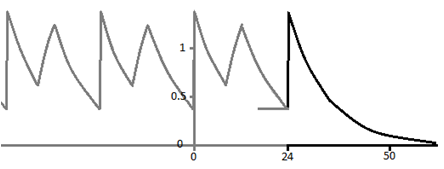
More complex example: Suppose the volume of a 1-compartment model is 1. Suppose it is desired to say that at time 24, one can assume a continuous series of dosing cycles taking place, where the cycle consists of first a bolus dose of 1 unit, and then 8 hours later a 4-hour infusion of 1 unit is given. Then the next cycle starts 24 hours after the initial bolus. Also suppose at time 24 a single bolus of 1mg is given.
The following plot shows concentration versus time. Notice that at time 24, when the actual dose is given, the prior concentration is not zero. It is about 0.4, because of the prior assumed dosing cycles, shown in light gray.

This situation is set up as follows:
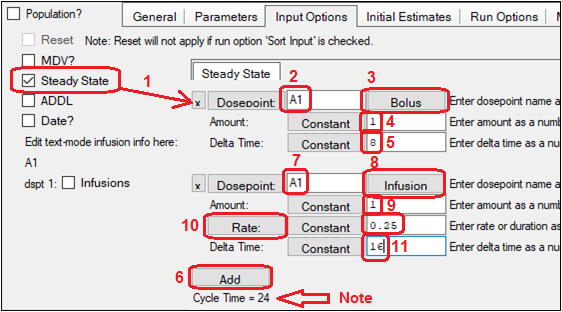
1. On the Input Options tab, check the Steady State option to display the Steady State sub-tab.
2. Enter the name of the dosepoint to receive the dose, if necessary (e.g., A1).
3. Set up the initial bolus by making sure the Bolus/Infusion option is set to Bolus.
4. Enter the amount of the dose (e.g., 1 unit).
5. Enter the wait time before the next dose (e.g., 8 time units).
6. Click the Add button to enter the second dose.
7. Enter the name of the dosepoint (which does not have to be the same as the prior dosepoint).
8. Make sure the Bolus/Infusion button says Infusion.
9. Enter the amount of the infusion (e.g., 1 unit).
10. Make sure the Rate/Duration button says Rate and enter the rate (e.g., 0.25 drug units per time unit).
11. Enter the time that passes before the cycle repeats (e.g., 16 time units).
Note the total cycle time appears below the Add button.

The concentration-time curve in the graph shown earlier in this section arose from the following dosing input:

This says two things:
•At time t=24 the model is put into steady-state on the assumption that the dosing cycle above occurred at t – 24, t – 48, etc., but not at time t.
•A bolus dose of 1 unit is given at time t.
Note that the delta-time comes after the dose. The reason for this is that the dose may be an infusion; it may have a tlag; it may be zero-order (implied infusion). These delayed aspects of the dose have to be completed before the dosing cycle completes. This might be considered a limitation of the software, but it is necessary to assume that if a subject is in steady-state prior doses have actually completed.
