When all desired files are selected, they can be exported into a Microsoft Word document or a Microsoft PowerPoint presentation.
By default, inserting tables and charts into Microsoft Word or PowerPoint creates image objects in those applications. The image objects are easy to insert and create a relatively small document size, but there are limits as to what can be done with the output after it has been created.
If post-insertion editing such as adding additional titles or footnotes is necessary in the output document, select the Insert results as editable objects checkbox prior to inserting the files.
Using this feature allows AutoPilot File Explorer to embed copies of the files into Microsoft Word or PowerPoint so that they can be edited using the original application that created the object. Tables are inserted as Microsoft Excel objects and charts are inserted as SigmaPlot chart objects.
Editing inserted tables
Editing inserted charts
Undoing edits
The same editing options are available in Microsoft Word and PowerPoint.
There are two options for editing a table that has been inserted as editable: edit directly in Word or open an instance of Microsoft Excel and edit the table using Excel.
Edit Directly in Microsoft Word
-
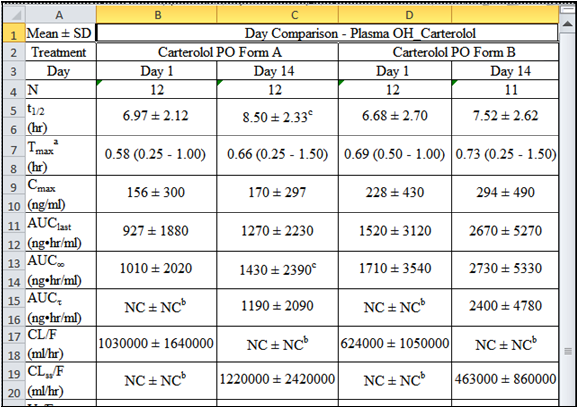
Click anywhere in the table object in Microsoft Word to directly edit the table.

Table being edited in Microsoft Word
-
When the edits are complete, click anywhere in the Microsoft Word document other than in the table. The table automatically updates in Word.
Edit in Microsoft Excel
-
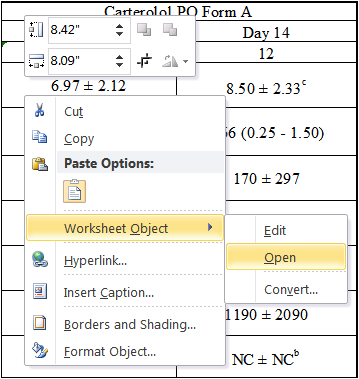
Right-click the table and select Worksheet Object > Open in the context menu.

Right-click menu option to edit a table in Microsoft Excel
A new instance of Microsoft Excel opens and the selected table loads into Excel.
-
Edit the table within Excel.
-
When the edits are finished, close Excel. Any changes made to the table are reflected in the Word document.
The same editing options are also available in Microsoft PowerPoint.
The same methods used to edit tables can be used to edit charts and the same editing options are available in Microsoft Word and PowerPoint.
There are two options to edit a chart that has been inserted as editable: edit directly in Word or open an instance of SigmaPlot and edit the table using SigmaPlot.
Edit directly in Microsoft Word
-
Click anywhere in the chart object in Microsoft Word to directly edit the chart.
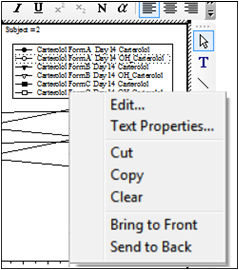
During in-place editing, full access to SigmaPlot context menus and dialog boxes is available by right-clicking on any object within the chart. In the example above the legend text has been selected for editing within the SigmaPlot Edit Text dialog.

Right-click menu options when editing a chart in Microsoft Word
-
When the edits are complete, click anywhere in the Microsoft Word document other than in the chart. The chart automatically updates in Word.
Edit in SigmaPlot
-
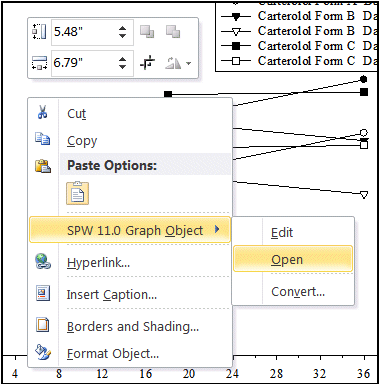
Right-click the chart and select SPW xx Graph Object > Open from the context menu (xx: the SigmaPlot version number).

Right-click menu option to edit a chart in SigmaPlot directly
A new instance of SigmaPlot opens and the selected chart is loaded.
-
Edit the chart in SigmaPlot.
-
When the edits are finished, close SigmaPlot. Any changes made to the chart are reflected in the Word document.
Note:Due to a known issue in SigmaPlot 12.x, graphs may not completely get exported from SigmaPlot as editable objects into Word or PowerPoint.
To undo any unwanted changes made to a table or chart, select Undo Object from the Word or PowerPoint Edit menu. This reverts the last change or set of changes that were made to the object during editing. Microsoft Word and PowerPoint keep track of all changes and allows multiple undo operations.
