Population and individual bioequivalence
Population and individual bioequivalence are used to assess switchability and prescribability. Because individual bioequivalence relies on estimates of within-subject, within-formulation variation, replicated crossover designs are required. This algorithm was developed by Francis Hsuan. Designs that can be appropriately analyzed include, but are not limited to,
|
Sequence |
Period |
Design |
|
2 |
4 |
TRTR/RTRT |
|
4 |
4 |
TRTR/RTRT/TRRT/RTTR |
|
4 |
2 |
TT/RR/TR/RT |
|
4 |
3 |
TRT/RTR/TRR/RTT |
|
2 |
5 |
TRRTT/RTTRR |
|
3 |
3 |
TRR/RTR/RRT |
|
2 |
3 |
RTR/TRT |
|
6 |
3 |
TRR/RTT/TRT/RTR/TTR/RRT |
|
2 |
4 |
TRRR/RTTT |
|
6 |
4 |
TTRR/RRTT/TRRT/RTTR/TRRR/RTTT |
The algorithm works for balanced and unbalanced data with an equal number of periods in each sequence and one measurement per subject in each period.
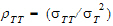
Population bioequivalence (PBE) criteria are:
|
|
(1) |
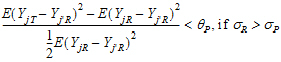
where sP defaults to 0.2 and  qP=(ln(1 – PercentReference)+eP) /sP2. The default value for PercentReference is 0.20. In the Bioequivalence object, sP is called the Total SD standard. sR2 is computed by the program and is the total variance of the reference formulation, i.e., the sum of within- and between-subject variance. The criteria take the linearized form:
|
|
(2) |
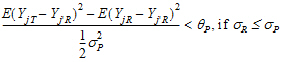
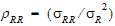
Individual bioequivalence (IBE) criteria are:
|
|
(3) |
where sI defaults to 0.2 and  I=(ln(1 – PercentReference)+eI) /sI2. The default value for Percent Reference is 0.20, and the default value for eI is 0.05. In the Bioequivalence object, sI is called the within-subject SD standard. sWR is computed by Phoenix, and its square, sWR2, is the within-subject variance of the reference formulation.
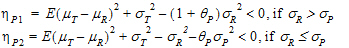
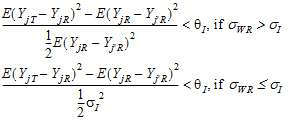
The IBE criteria take the linearized form:
|
|
(4) |
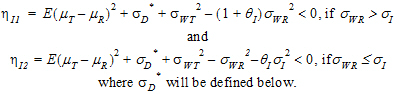
For reference scaling, use  P1 or
P1 or  I1. For constant scaling, use
  P2 or
P2 or  I2. For mixed scaling, use one of the following.
Population
•If sR > sPv, use  P1
P1
•If sR £ sP, use  P2
P2
Individual
•If sWR > sI, use  I1
I1
•If sWR £ sI, use  I2
I2
If the upper bound on the appropriate  is less than zero, then the product is bioequivalent in the chosen sense. The interval is set in the Bioequivalence object’s Options tab. The method of calculating that upper bound follows.
Let:
Yijkt be the response of subject j in sequence i at time t with treatment k.
 be a vector of responses for subject j in sequence i. The components of Y are arranged in the ascending order of time.
 .be the design vector of treatment T in sequence i.
 be a design vector for treatment R in sequence i.
ni > 1 be the number of subjects in sequence i.
Assume the mean responses of  , follow a linear model:
|
|
(5) |

where  T,
T,  R are the population mean responses of Y with treatments T and R respectively, and Xi are design/model matrices.
Let:
 be the number of occasions T is assigned to the subjects in sequence i.
 be the number of occasions R is assigned to the subjects in sequence i.
Then:
|
|
(6) |
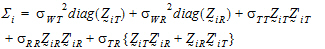
Assume that the covariances:
|
|
(7) |

follow the model:
|
|
(8) |
where the parameters:
|
|
(9) |
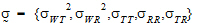
are defined as follows:
• and
and 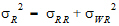 are var
  and var
  .
.
• = intra-subject correlation coeff. corr
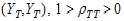 .
.
• = intra-subject correlation coeff. corr
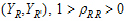 .
.
• = intra-subject correlation coeff. corr
 .
.
• , and
, and  are intra-subject covariances.
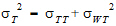
•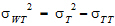 is the intra-subject variance
  .
.
•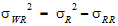 is the intra-subject variance
  .
.
For PBE and IBE investigations, it is useful to define additional parameters:
|
|
(10) |
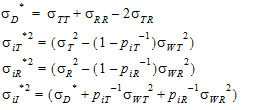
Except for sD*, all the quantities above are non-negative when they exist. It satisfies the equation:
|
|
(11) |
In general, this sD* may be negative. This method for PBE/IBE is based on the multivariate model. This method is applicable to a variety of higher-order two-treatment crossover designs including TR/RT/TT/RR (the Balaam Design), TRT/RTR, or TxRR/xRTT/RTxx/TRxx/xTRR/RxTT (Table 5.7 of Jones and Kenward, page 205).
Given the ith sequence, let:
|
|
(12) |
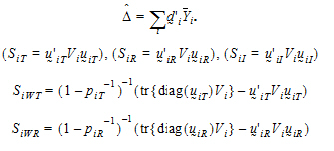
where:
 is the sample mean of the ith sequence.
Vi is the within-sequence sample covariance matrix.
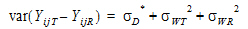
It can be shown that:
|
|
(13) |
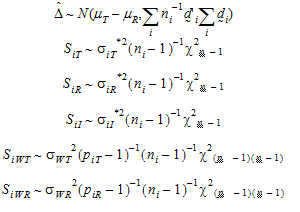
Furthermore, it can be shown that {SiT, SiR} (for PBE) are statistically independent from { } and {SiWT, SiWR}, and that the four statistics
  , SiI, SiWT, SiWR (for IBE) are statistically independent.
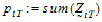
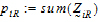
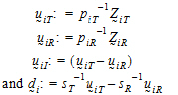
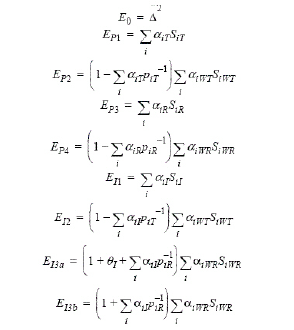
Let ai be sets of normalized weights, chosen to yield the method of moments estimates of the  . Then define the estimators of the components of the linearized criterion by:
|
|
(14) |
Using the above notation, one may define unbiased moment estimators for the PBE criteria:
|
|
(15) |
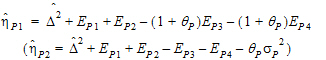
and for the IBE criteria:
|
|
(16) |
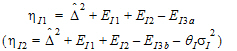
Construct a 95% upper bound for  based on the TRTR/RTRT design using Howe’s approximation I and a modification proposed by Hyslop, Hsuan and Holder (2000). This can be generalized to compute the following sets of nq, H, and U statistics:
|
|
(17) |
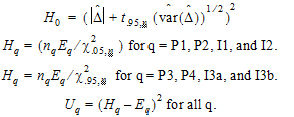
where the degrees of freedom nq are computed using Satterthwaite’s approximation. Then, the 95% upper bound for each  is:
is:
|
|
(18) |
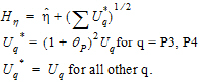
If Hq < 0, that indicates bioequivalence; Hq > 0 fails to show bioequivalence.
Anderson and Hauck (1983). A new procedure for testing equivalence in comparative bioavailability and other clinical trials. Commun Stat Theory Methods, 12:2663–92.
Chow and Liu (2nd ed. 2000 or 3rd ed. 2009). Design and Analysis of Bioavailability and Bioequivalence Studies, Marcel Dekker, Inc.
Hauschke, Steinijans, Diletti, Schall, Luus, Elze and Blume (1994). Presentation of the intrasubject coefficient of variation for sample size planning in bioequivalence studies. Int J Clin Pharm Ther 32(7): 376–378.
Hyslop, Hsuan and Holder (2000). A small sample on interval approach to assess individual bioequivalence. Statist Medicine 19:2885–97.
Schuirmann (1987). A comparison of the two one-sided tests procedure and the power approach for assessing the equivalence of average bioavailability. J Pharcokinet Biopharm 15:657–680.
Snedecor and Cochran (1989). Statistical Methods, 8th edition, Iowa State Press.
US FDA Guidance for Industry (March 2003). Bioavailability and Bioequivalence Studies for Orally Administered Drug Products—General Considerations.
US FDA Guidance for Industry (January 2001). Statistical Approaches to Establishing Bioequivalence.
Phillips, K. F. (1990). Power of the Two One-Sided Tests Procedure in Bioequivalence. Journal of Pharmacokinetics and Biopharmaceutics 18: 137–144.
Diletti, E., Hauschke, D., and Steinijans, V. W. (1991). Sample size determination for bioequivalence assessment by means of intervals. Int. J. of Clinical Pharmacology, Therapy and Toxicology 29: 1–8.
Owen, D. B. (1965). A Special case of a bivariate noncentral t-distribution. Biometrika 52: 437–446.
