•Change the parameters and title
•Change the LOESS absolution regression line format
Regression lines are only available for XY graphs.
Change the parameters and title

-
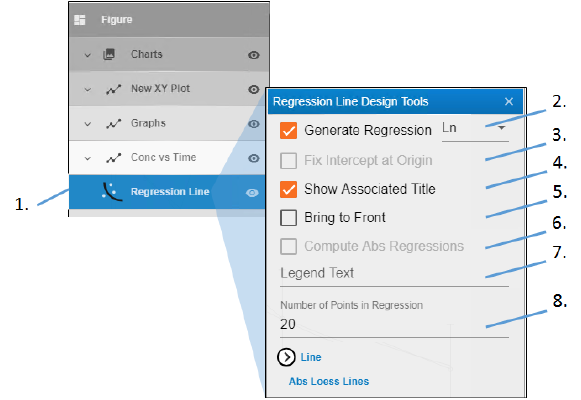
Expand the heading showing the graph name for the XY plot and double-click Regression Line.
-
Check the Generate Regression box to display a regression line on the plot, then choose the type of regression line: Ln (log base e), Linear, LOESS (LOcally wEighted Scatter plot Smoothing).
-
Check the Fix Intercept at Origin box to fix the intercept of a linear regression line at the plot’s origin. This option is only available when Linear regression is specified, as Ln and LOESS do not use intercept values.
-
Uncheck the Show Associated Title box to not display the regression line equation in the legend.
-
Check the Bring to Front box to display the regression line in front of the data points.
-
Check the Compute Abs Regressions box to fit a LOESS regression to the absolute values of the dependent variable, in addition to the normal LOESS regression that does not take absolute values. The reflection of the absolute value fit through the X-axis is also included. This is useful when the magnitudes of the dependent variable are more important than the signed values, for example, weighted residuals.
If Compute Abs Regressions is checked, you can also format the LOESS absolute regression line display. See “Change the LOESS absolution regression line format”. -
Use the Legend Text field to type a name to show in the legend for the regression line. (This text will replace the line equation for a Ln or Linear regression line.)
-
In the Number of Points in Regression field, type the number of points at which to evaluate and plot the regression line.
Note:If a regression line is selected, the values used to create the line are displayed in the legend.
Ln: the log of the Y slope and the values of a and b.
Linear: The R-squared, intercept estimate, and slope estimate values are displayed.
LOESS: Nothing is displayed.

-
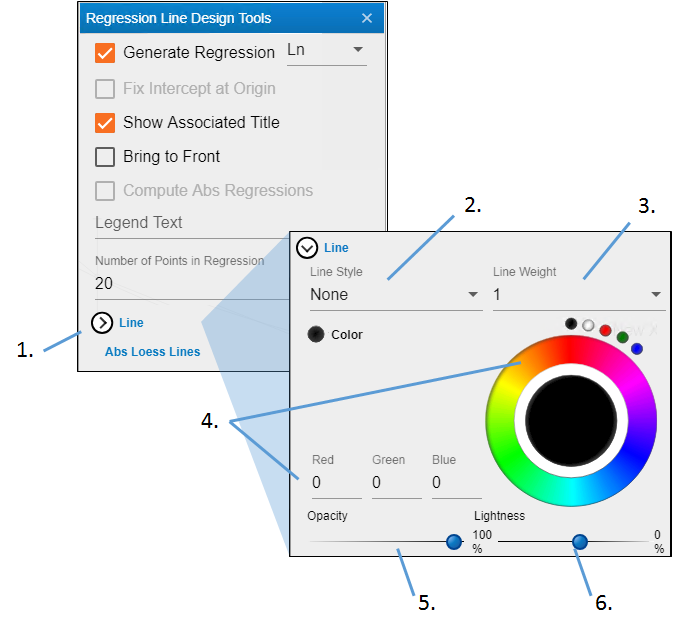
Click Line to view the settings.
-
Use the Line Style pulldown menu to choose the style for the reference line (None displays a solid line).
-
Enter the thickness for the line in the Line Weight field.
-
Click in the color wheel to select a color (or you can click one of the smaller circles to choose a more standard color). Alternatively, enter the RGB value for the desired color in the Red, Green, and Blue fields.
-
Adjust the Opacity of the color by moving the ball along the line. The farther to the right, the more solid the color, the farther to the left, the more transparent.
-
Adjust the Lightness of the color by moving the ball along the line. The farther to the right, the more white is mixed with the color, the farther to the left, the more black is mixed with color.
Change the LOESS absolution regression line format

-
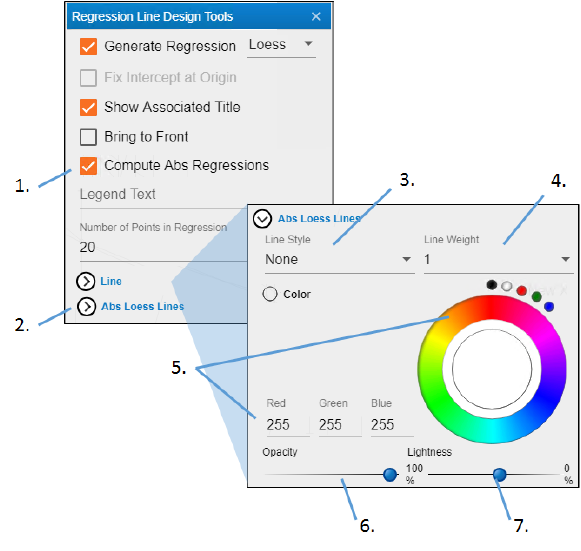
Check the Compute Abs Regressions box.
-
Click Abs Loess Lines to view the settings.
-
Use the Line Style pulldown menu to choose the style for the reference line (None displays a solid line).
-
Enter the thickness for the line in the Line Weight field.
-
Click in the color wheel to select a color (or you can click one of the smaller circles to choose a more standard color). Alternatively, enter the RGB value for the desired color in the Red, Green, and Blue fields.
-
Adjust the Opacity of the color by moving the ball along the line. The farther to the right, the more solid the color, the farther to the left, the more transparent.
-
Adjust the Lightness of the color by moving the ball along the line. The farther to the right, the more white is mixed with the color, the farther to the left, the more black is mixed with color.
