This example demonstrates how to model a urine study. The time range, concentration, and data is provided in urine.xls. The dosing data are stored in urine_sources.xls. These files are located in the Phoenix examples directory.
The completed project (NCA.phxproj) is available for reference in …\Examples\WinNonlin.
Set up the NCA object
-
From within an open project, import the two files …\Examples\WinNonlin\Supporting files\urine.xls and urine_sources.xls.
In the File Import Wizard dialog, select the Has units row option for both worksheets. -
Select Workflow in the Object Browser and then select Insert > NCA and Toolbox > NCA.
-
Rename the NCA object just added as urine.
-
In the Options tab, set the Model Type to Urine (210-212).
-
Drag the urine worksheet from the Data folder to the urine object’s Main Mappings panel to map it as the input source.
-
In the Main Mappings panel, map the data types to the following contexts:
Map Lower to the Start Time context.
Map Upper to the End Time context.
Leave Concentration mapped to the Concentration context.
Leave Volume mapped to the Volume context. -
Select Dosing in the Setup list.
-
Drag the urine_sources item from the Data folder to the Dosing panel.
Type is already mapped to the None context.
Dose is already mapped to the Dose context.
Time is already mapped to the Time context. -
Select Therapeutic Response in the Setup list.
-
In the Therapeutic Response panel, check the Use Internal Worksheet checkbox.
-
In the first cell of the Lower column, enter 4.
Execute and view the NCA results
All necessary settings are complete.
-
Click
 to execute the object. The results are displayed on the Results tab.
 -
In the Results tab, click Final Parameters.
-
Click Summary Table.
-
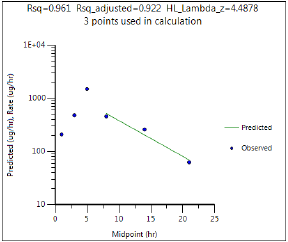
Click Observed Y and Predicted Y vs X.
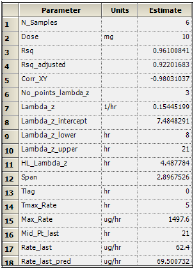
Part of the Final Parameters worksheet
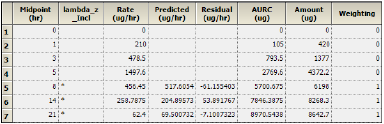
Values used in the calculation of Lambda Z are marked with an asterisk in the Lambda_z_Incl column.
This concludes the urine study example.
