Data mapping is the process of associating a dataset with an operational object so that objects can use the data in an analysis or other function. Data mapping in Phoenix is as simple as dragging a dataset from the Data folder to an object’s input, or using the Select Object dialog to select a dataset.
There multiple types of data mapping in Phoenix:
-
Mapping a dataset to an operational object: Datasets can be mapped to the different panels in an object’s Setup list, or they can be mapped to an object’s inputs in the Diagram tab.
-
Mapping context associations: Context mapping is the process of linking a specific column in a dataset to a specific context in an operational object, such as Time or Concentration.
Phoenix can complete context mappings if a column header in a worksheet matches the context name in an operational object. The Global Contexts and Context Association panels in the Preferences dialog can be used to automatically associate columns in a dataset with contexts in an operational object. For example, Phoenix can be set to map a concentration column named conc to an operational object’s concentration context.
Mapping a dataset to an operational object
Every operational object includes a data input panel in the Setup tab that is used to identify how input variables are used in an operational object.
Most primary data input panels contains two tabs: the Mapping tab, where columns in a dataset are mapped to an object’s inputs, and a sort order tab, which allows users to sort dataset columns. The Table object or the NONMEM, PsN, R Script, SAS, and SigmaPlot objects only have a Mappings panel.
Users can map a dataset or other worksheet to almost any item in the Setup tab list using the same instructions listed below. Note that the R Script and SAS Shell objects must have a script mapped to them before their inputs are defined. The PsN Shell object must have at least one model mapped to it before the input can be defined.
Once the dataset is mapped to the object’s Mappings panel, the dataset name is displayed beside the primary data input in the Setup tab list.
To map a dataset using the data mappings panel
In the data mappings panel, click  to open the Select Object dialog.
Click the (+) sign beside the Data folder.
Select a dataset and click Select.
Or
Use the pointer to select and drag a dataset from the Data folder to the object’s data mappings panel.
To map a dataset using the Diagram tab
Select the workflow object in the Object Browser.
In the Diagram tab, click  to expand the object box.
Click the (+) sign beside Inputs.
Drag the dataset from the Data folder to the primary data input.
The line between the External Sources box and the object box represents the data mapping.
To map a dataset using the “Send To” menu option
Select the object in the Object Browser to return to the Setup tab.
Right-click an imported worksheet and select Send To > <Mouse Click> (object group) > (operational object).
The Send To command inserts the new object into the workflow with the right-clicked worksheet already mapped as the input source.
Mapping results to an operational object
The results worksheet of any operational object can also be mapped to another operational object.
To map results from the Setup tab
Click  in the operational object’s Setup tab to open the Select Object dialog.
Click the (+) signs beside Project > Workflow > Operational Object > Results to expand the menu tree.
Select the results worksheet and click Select.
To map results from the worksheet
Right-click a results worksheet and select Send To > <Mouse Click> (object group) > (operational object).
Context associations are inputs to an operational object. Contexts that must have data mapped to them so the object can perform its function are shaded orange. Most items in an operational object’s Setup list have a Mappings panel that allows users to match columns in a dataset to inputs in an operational object.
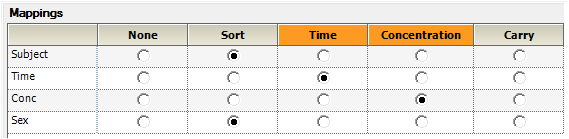
Context associations for NCA model 200
Column headers in the dataset are displayed on the left side and context associations for the operational object are displayed across the top.
-
Select the option button underneath each context and beside the column that provides the data for the input.
-
Repeat for each item in the Setup tab list that requires mapping data to inputs.
