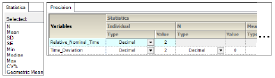
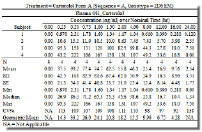
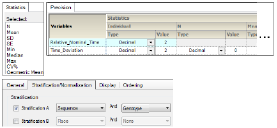
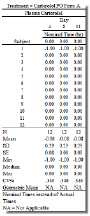
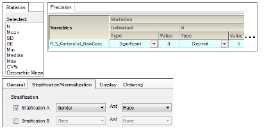
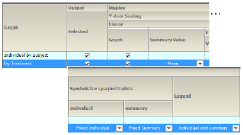
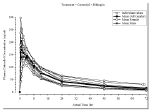
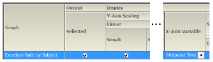
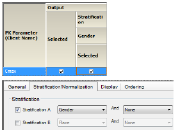
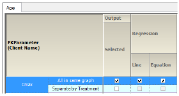
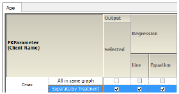
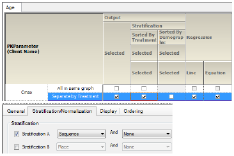
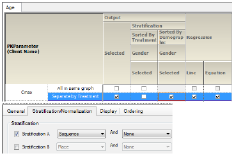
For each example, images of the output table/graph and settings used when creating the table are included.
•Plasma time concentration tables
•Trough time concentration tables
•Urine time concentration tables
•Plasma time concentration graphs
•Urine time concentration graph
•Trough time concentration graphs
•Plasma and urine categorical standard PK parameter graphs
•Plasma and urine categorical box and whisker PK parameter graphs
•Plasma and urine continuous dose standard PK parameter graphs
•Plasma and urine continuous dose box and whisker PK parameter graphs
•Plasma and urine continuous demographic PK parameter graphs
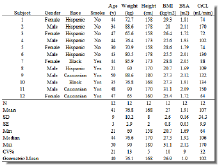
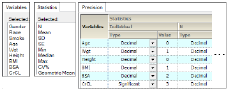
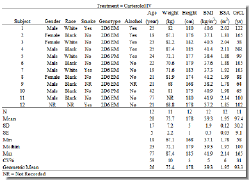
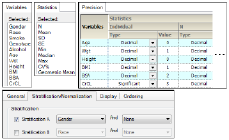
Demographic stratified by group
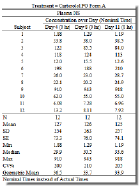
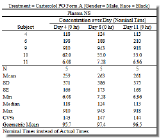
Plasma time concentration tables
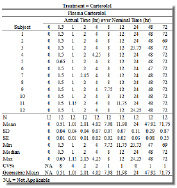
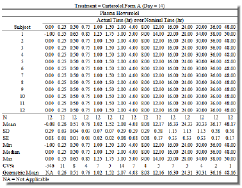
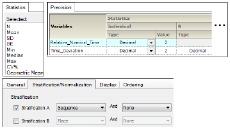
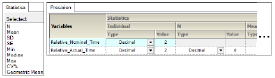
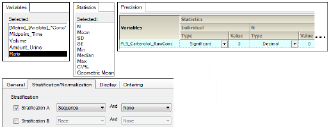
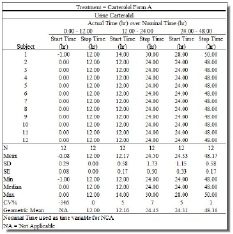
Actual times stratified by group
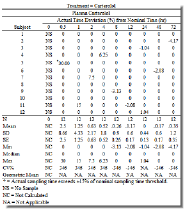

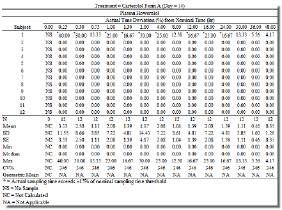
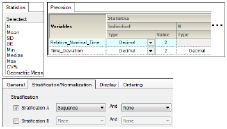
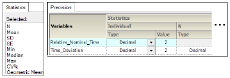
Actual times deviation stratified by group
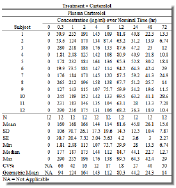
Concentration stratified by group
Trough time concentration tables
Trough concentrations stratified by group
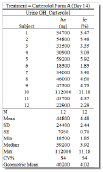
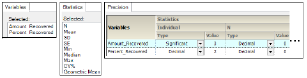
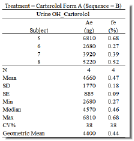
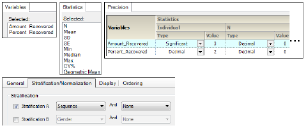
Urine time concentration tables
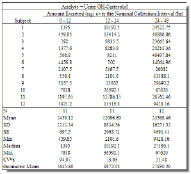
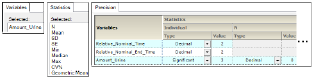
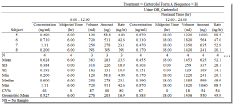
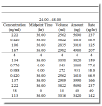
Urine amount stratified by group
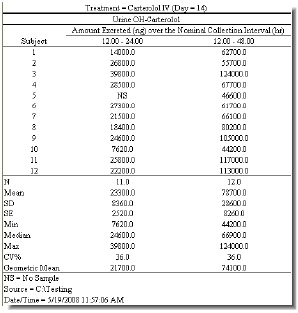
Urine cumulative amount stratified by group
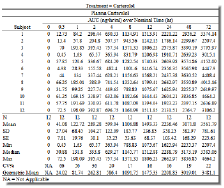
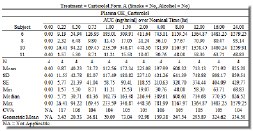
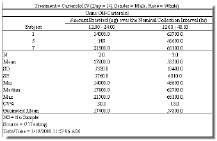
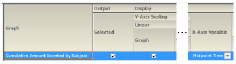
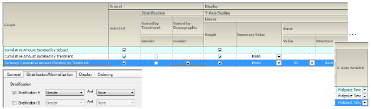
Cumulative AUC stratified by group
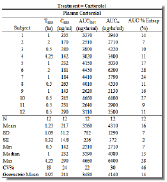
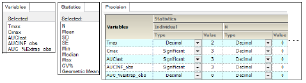
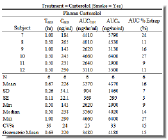
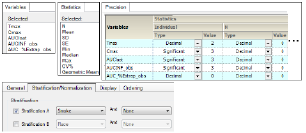
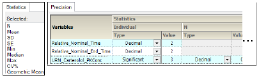
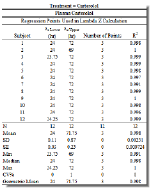
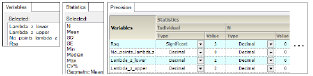
Plasma PK parameter stratified by group
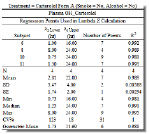
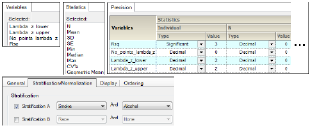
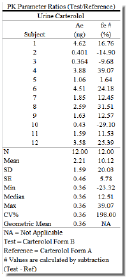
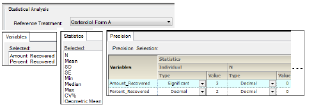
Urine PK parameter stratified by group
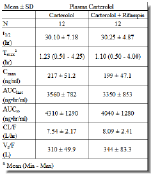
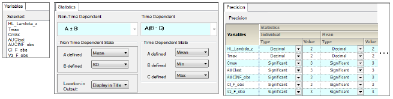
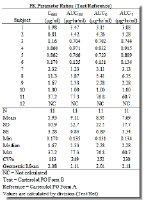
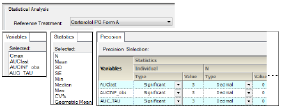
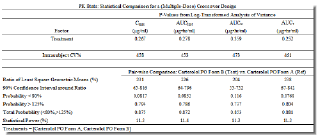
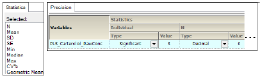
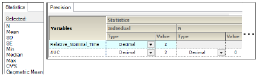
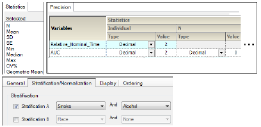
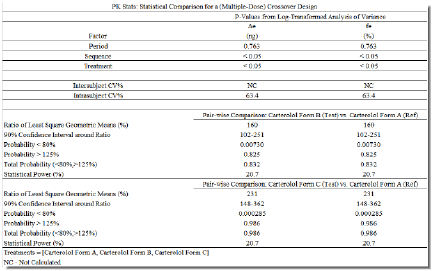
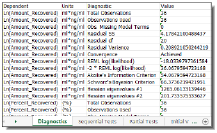
Plasma PK statistics table with multiple tabs of data.
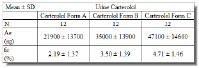
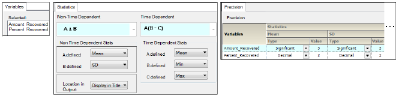
Urine PK statistics table with multiple tabs of data.
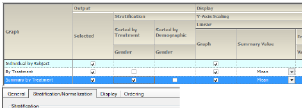
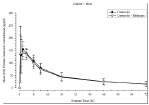
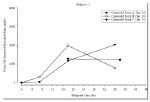
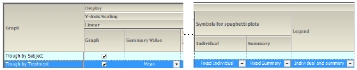
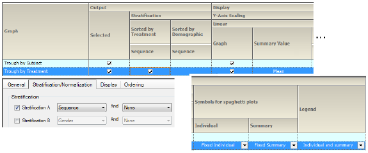
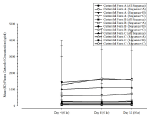
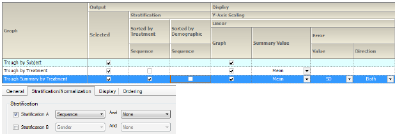
Plasma time concentration graphs
•Concentration by treatment, sorted by treatment and strat. by group
•Summary conc. by treatment, sorted by treatment, and strat. by group
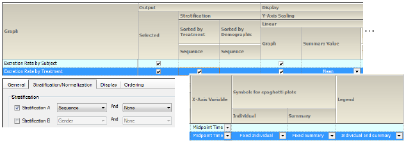
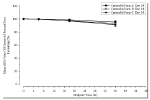
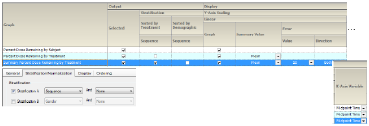
•Summary conc. by treatment, sorted and strat. by group
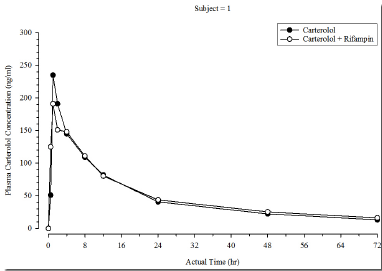
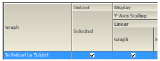
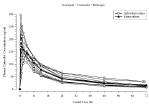
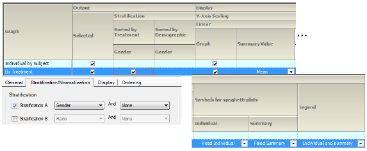
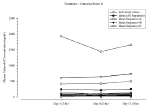
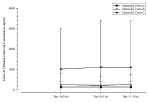
Concentration by treatment, sorted by treatment and strat. by group
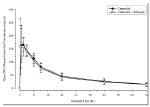
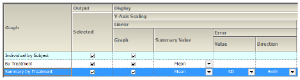
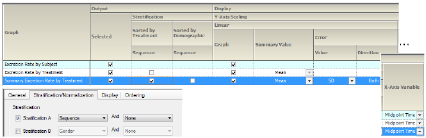
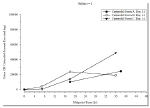
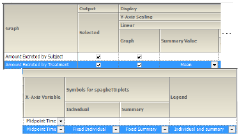
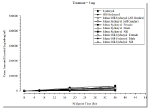
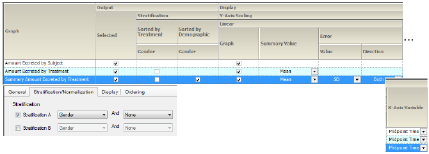
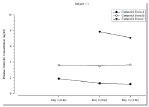
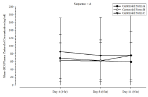
Summary concentration by treatment
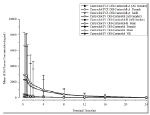
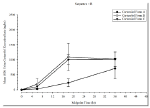
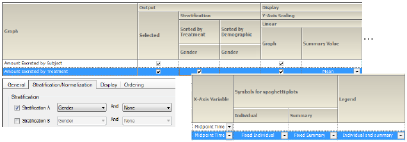
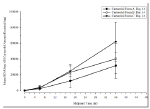
Summary conc. by treatment, sorted by treatment, and strat. by group
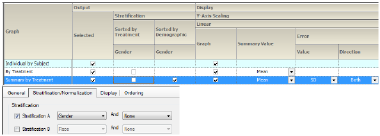
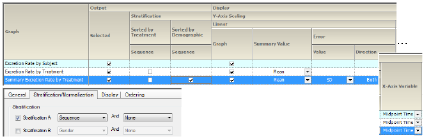
Summary conc. by treatment, sorted and strat. by group
Urine time concentration graph
•Excretion rate by treatment, sorted by treatment, and strat. by group
•Summary excretion rate by treatment, sorted by treatment, and strat. by group
•Summary excretion rate by treatment, sorted and strat. by group
•Percent dose remaining by treatment, sorted by treatment, and strat. by group
•Summary percent dose remaining by treatment, sorted by treatment, and strat. by group
•Summary percent dose remaining by treatment, sorted and strat. by group
•Cumulative amt. excreted by treatment, sorted by treatment, and strat. by group
•Summary cum. amt. excreted by treatment, sorted by treatment, and strat. by group
•Summary cum. amt. excreted by treatment, sorted and strat. by group
•Amount excreted by treatment, sorted by treatment, and strat. by group
•Summary amt. excreted by treatment, sorted by treatment, and strat. by group
•Summary amt. excreted by treatment, sorted and strat. by group
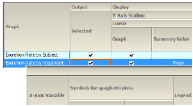
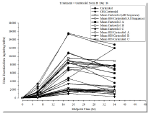
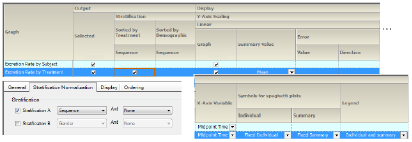
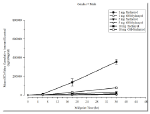
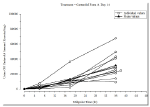
Excretion rate by treatment, sorted by treatment, and strat. by group
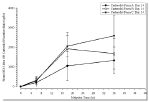
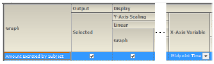
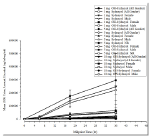
Summary excretion rate by treatment
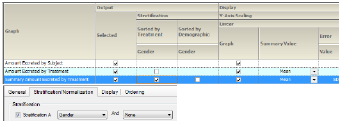
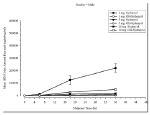
Summary excretion rate by treatment, sorted by treatment, and strat. by group
Summary excretion rate by treatment, sorted and strat. by group
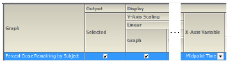
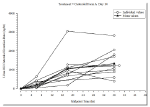
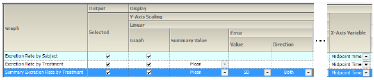
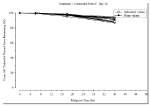
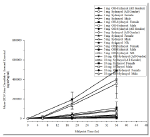
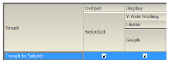
Percent dose remaining by subject
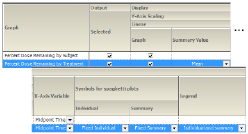
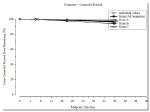
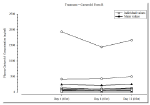
Percent dose remaining by treatment
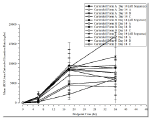
Percent dose remaining by treatment, sorted by treatment, and strat. by group
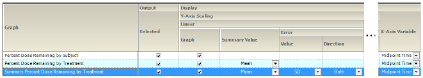
Summary percent dose remaining by treatment
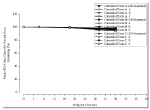
Summary percent dose remaining by treatment, sorted by treatment, and strat. by group
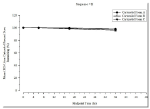

Summary percent dose remaining by treatment, sorted and strat. by group
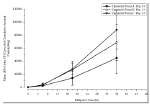
Cumulative amount excreted by subject
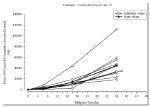
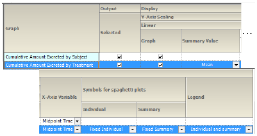
Cumulative amount excreted by treatment
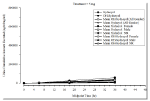
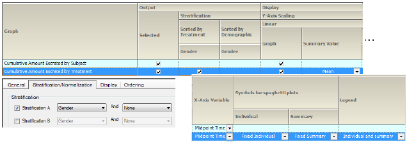
Cumulative amt. excreted by treatment, sorted by treatment, and strat. by group
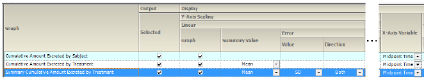
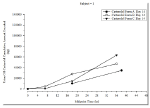
Summary cum. amt. excreted by treatment

Summary cum. amt. excreted by treatment, sorted by treatment, and strat. by group
Summary cum. amt. excreted by treatment, sorted and strat. by group
Amount excreted by treatment, sorted by treatment, and strat. by group
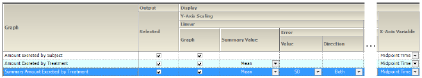
Summary amount excreted by treatment
Summary amt. excreted by treatment, sorted by treatment, and strat. by group
Summary amt. excreted by treatment, sorted and strat. by group
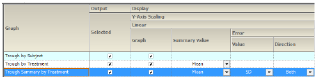
Trough time concentration graphs
•Concentration by treatment, sorted by treatment, and strat. by group
•Summary conc. by treatment and strat. by group
•Summary conc. by treatment and strat. by group value
Concentration by treatment, sorted by treatment, and strat. by group
Summary concentration by treatment
Summary conc. by treatment and strat. by group

Summary conc. by treatment and strat. by group value
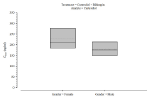
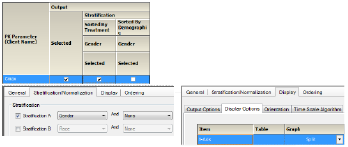
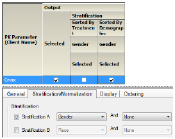
Plasma and urine categorical standard PK parameter graphs
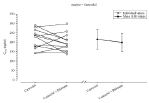
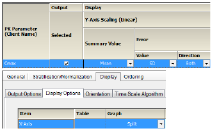
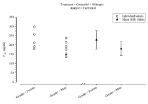
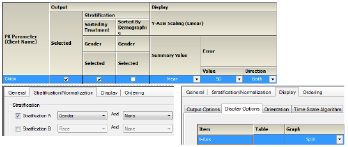
PK parameter sorted by treatment and strat. by group
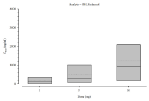
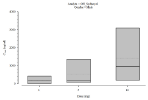
Plasma and urine categorical box and whisker PK parameter graphs
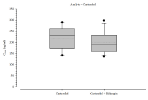
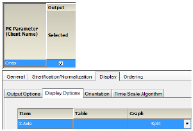
Box and whisker PK parameter sorted by treatment and strat. by group
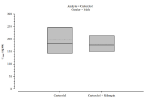
Box and whisker PK parameter sorted and strat. by group
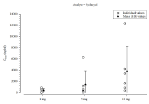
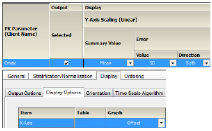
Plasma and urine continuous dose standard PK parameter graphs
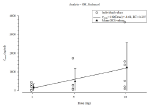
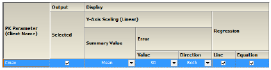
PK parameter by dose sorted by treatment and strat. by group
PK parameter by dose sorted and strat. by group
Plasma and urine continuous dose box and whisker PK parameter graphs

Box and whisker PK parameter by dose
Box and whisker PK parameter by dose and strat. by group
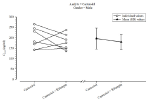
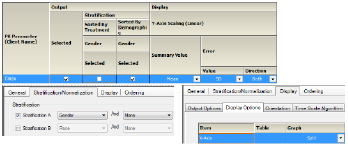
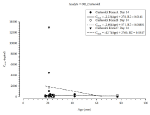
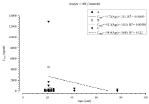
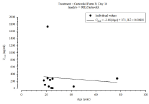
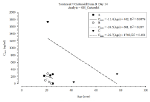
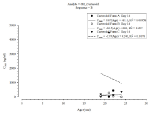
Plasma and urine continuous demographic PK parameter graphs
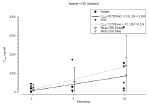
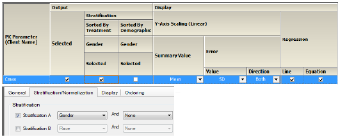
•PK parameter vs. continuous demographic sorted by treatment and strat. by group
•PK parameter vs. continuous demographic by treatment, sorted by treatment and strat. by group
•PK parameter vs. continuous demographic by treatment, sorted and strat. by group
PK parameter vs. continuous demographic

PK parameter vs. continuous demographic sorted by treatment and strat. by group
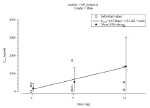
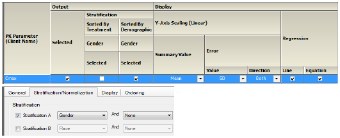
PK parameter vs. continuous demographic by treatment
PK parameter vs. continuous demographic by treatment, sorted by treatment and strat. by group
PK parameter vs. continuous demographic by treatment, sorted and strat. by group
