Phoenix estimates the rate constant Lambda Z, which is associated with the terminal elimination phase for concentration data. These measurements are estimated using the linear or the linear-log trapezoidal rules, which are selected in the Calculation Method menu in the Options tab. If Lambda Z is estimable, parameters for concentration data are extrapolated to infinity.
The following section contains usage instructions. For descriptions of how the WagnerNelson model determines Lambda Z or slope estimation settings, see “Lambda Z or Slope Estimation Settings”.
If the observation data does not extend significantly into the terminal phase, then selecting Observed in the Area Under the Curve menu can cause the model to significantly underestimate the actual AUCINF. For example, if the absorption phase was not completed, then scaling errors can occur when Phoenix computes the fraction absorbed.
To define the Lambda Z or slope estimation settings
-
Select Slopes Selector in the Setup tab.
The observed times for each profile are displayed on a graph. A graph for each profile is listed on separate tabs in the Slopes Selector panel. -
Use the View menu to select a linear (Lin) or logarithmic (Log) axis scale.
-
Use the Lambda Z Calculation Method menu to select Best Fit, Time Range, or Parameters as the calculation method.
•If Best Fit is selected, Phoenix calculates the points for Lambda Z estimation for each profile.
•If Time Range is selected users must type the start and end times for Lambda Z estimation in the Start and End fields.
•If Parameters is selected users can type their own values in the Lambda Z and Intercept fields. Intercept values are optional, so if no intercept value is entered, Phoenix computes it as: 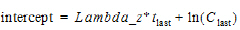
Since no specific points are used in the Lambda Z computation, the Lambda Z output in the Results tab will contain predicted and residual values for all time and concentration values. Any start times, end times, Lambda Z values, and intercept values must be greater than zero.
-
In the Area Under the Curve menu, select a method to use to calculate the AUC to time=infinity.
•If Predicted is selected, then Phoenix calculates the area under the curve (AUC) as AUC¥=AUClast+Clast/Lambda_z, where Clast is the last predicted concentration.
•If Observed is selected, then Phoenix calculates the AUC as AUC¥=AUClast+Clast/Lambda_z, where Clast is the last observed concentration.
•If Specified is selected, then users can type a value for the AUC in the specified values field. The AUC value must be greater than zero.
Caution:If Specified is selected in the Area Under the Curve menu, then any user-specified Lambda Z Calculation Method settings are not applied to the Loo-Riegelman model results.
To set start times, end times, and exclusions
Users can manually select start times, end times, and excluded time points by selecting them on each profile graph.
Note:Manually selecting times and exclusions automatically sets the Lambda Z Calculation Method to Time Range.
-
Left-click a data point on a graph to select the start time.
-
Press SHIFT and left-click a data point on a graph to select the end time.
-
Press CTRL and left-click a data point on a graph to exclude the time point.
-
Remove or change the start time, end time, and exclusions by selecting new points on the graph using the same mouse and keyboard commands listed in steps 1 through 3.
When the start time, end time, and exclusions are manually selected, the graph title is updated to show the new R2 calculation, the graph is updated to show the new slope, and the legend is updated to show the new slope and exclusions, as shown below.
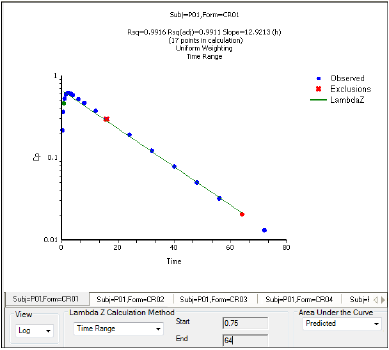
Manually selected start, end, and excluded time points for the first profile
Note:Excluded data points apply only to Lambda Z or slope calculations. The excluded data points are still included in the computation of AUCs, moments, etc.
